- ChainLink price continues to fall after the recent fallout of 200-DMA with an increase in selling volume.
- The technical chart of the coin may remain bearish if it continuously sustains below the critical levels, then we can witness more profit-booking.
- The pair or LINK/BTC is trading at 0.0005234 BTC with a critical loss of -19.52%, while LINK/BTC is CMP at 0.009113 ETH, with almost -12% loss in a day.
ChainLink price over the monthly chart has reached near the critical levels after making a bearish engulfing pattern. Due to the immense selling in the last month, the coin is now trading below the 200-DMA. After breaking the most influential trend line, LINK witnessed intense selling pressure, and price made a low of $17.38. Since the coin is trading below 20, 50, 100 and 200-DMA and the current market condition is extremely bearish, one can trade or invest against the growth of LINK coin price. No new long-side entry is suggested in the present trading scenario of ChainLink. Resistance on the higher side is at $30 and $42; while, a support level is $15.
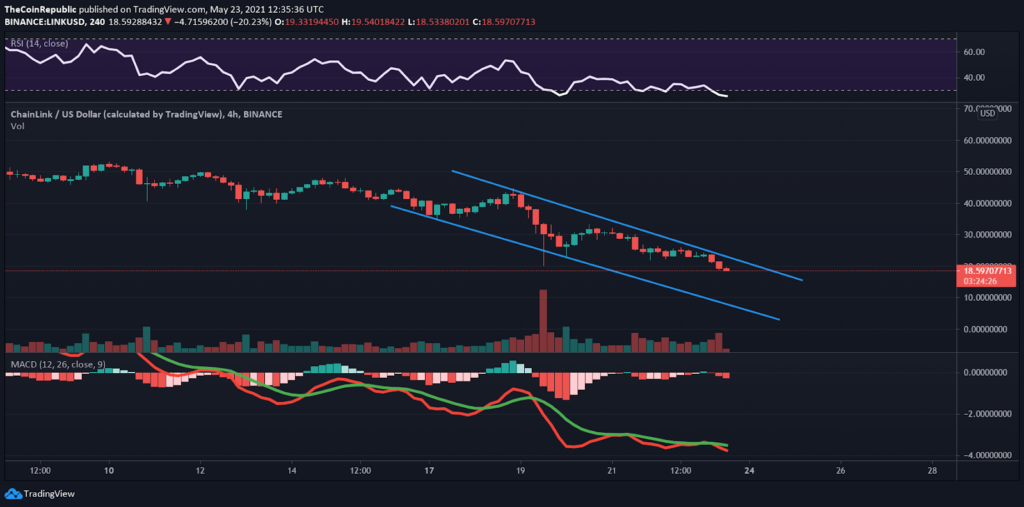
Downside Channel continues to grow in the 4-hour Time

LINK price in the 4-hour Time is trading under the bearish chart pattern and continues to trade in a downside channel pattern. The significant downtrend projects the bears are overpowering bulls, and there is no point of return in the trend.
Nonetheless, a breakout of either is possible with solid momentum. Presently, the coin is trading at $16.72 with an intraday loss of +33.17%, while volume dropped by -36.69%, standing at $2,015,693,497. LINK token price as per the technical indicators is suggesting no significant sign of recovery and support downside momentum.
Relative Strength Index (NEUTRAL): RSI line might rebound after testing the oversold zone. However, presently, it projects sideways momentum with no significant recovery and trailing near the oversold territory.
Moving Average Convergence Divergence (NEUTRAL) currently indicates a sideways trend on the 4-hour chart. It is trailing with the falling seller’s line (red) over the buyer’s signal line (green). As of now, LINK projects no significant recovery.
Support levels: $15
Resistance levels: $42 and $30
