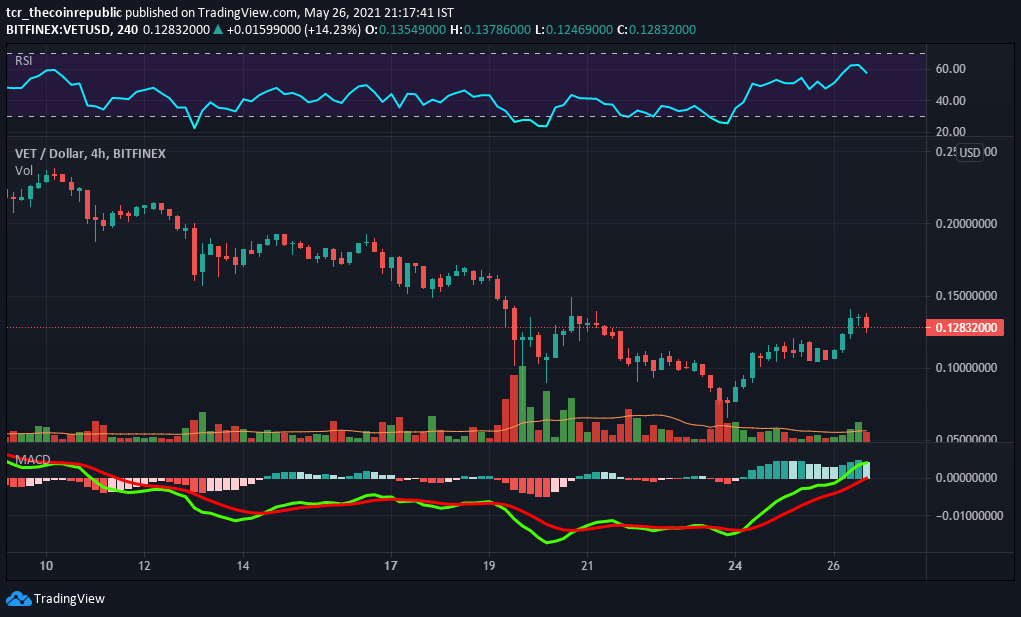
- Vechain coin price rebound sharply after a massive sell-off over the yearly chart; while still down by -53% from its ATH
- The coin placed above a 200-Day moving average and presently struggling near the 100-DMA line
- The pair of VET/BTC is trading positively at 0.000003293 BTC with a jump of +12%, and VET/ETH jumped over +8%, standing at 0.00004649 ETH
Vechain coin over the monthly chart is trading near the vital moving averages of 20, 50, and 100-DMA. While the closing above all moving averages will create a significant upsurge and at the same time, the volume also needs to improve. The coin, after facing considerable selling pressure, is now recovering gradually from the 200-DMA support. VET price can create another All-time high if the day candles start to sustain above all potential moving averages like 20, 50, 100, and 200-Day. After the negative crossover of 20 and 50-DMA, a positive crossover is now expected, which will create a bullish trend. Support on the lower side is at $0.0980 and $0.6590; likewise, resistance on the higher side is at $0.1450 and $0.1930.

At the weekly time frame, the Vechain coin price is trying to recover after a sharp selloff from a 52-week high of $0.2780. Presently, VET is trading at $0.1281 with an intraday gain of +14.14%, and the volume/market cap ratio is present at 0.2059. Volume in the last 24-hours jumped over +8,97%, and the total market cap stands at $8,251,759,961.
Relative Strength Index (BULLISH): RSI presently projects positive or bullish momentum over the weekly chart.
Moving Average Convergence Divergence (BULLISH) currently indicates a bullish trend on the daily chart. The buyer’s signal line (green) is more significant than the seller’s line (red).
Support levels: $0.0980 and $0.6590
Resistance levels: $0.1450 and $0.1930.
