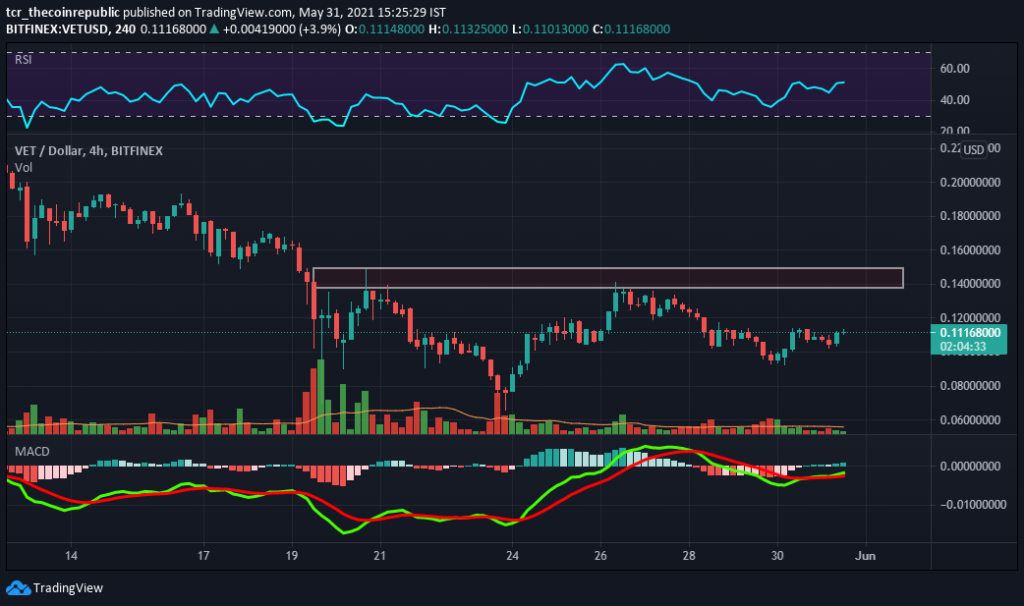
- Vechain price rebound successfully after testing support of 200-Day moving average and now struggling near the Fib level of 0.236
- The crypto asset is presently trading below the moving average (MA) of 20, 50, and 100-day while sustaining above 200-DMA
- The pair of VET/BTC is trading mildly positive with intraday gains of +0.56% standing at 0.000003094 BTC, and VET/ETH is CMP at 0.00004549 ETH with an intraday increment of +1.17%
Vechain price is struggling near the fib level of 0.236 and has taken good support of 200-DMA. The crypto asset has slipped below 20, 50, and 200-DMA while 100 and 50-DMA are acting as a strong resistance line. Good buying interest is observed near the 200-DMA, and the coin rebounds successfully from the lower levels.
Volume action over the monthly chart falls below the average line and needs to improve above the average line. Support on the lower side is at $0.0940 and $0.0660; likewise, resistance on the higher side is at $0.0.1475 and $0.1920 once the closing of day candles above 200 and 100-DMA will boost confidence to bulls.
Vechain Coin is Heading Towards The Final Supply Zone

Over the weekly chart, the Vechain coin is heading towards the final supply zone and can witness rejection from the distribution. While the technical parameters are gradually indicating positive momentum, and if the closing of the 4-Hour candle above the supply zone will create good positive momentum. Currently, VET is trading near at 0.11168 with an intraday gain of +1.76%, and the volume to market cap ratio stands at 0.1232. Whereas the crypto assent present at 20th rank with total market stands at $7,219,852,930.
Relative Strength Index (NEUTRAL): Vechain RSI is presently projecting sideways or caution momentum over the weekly chart.
Moving Average Convergence Divergence (NEUTRAL) currently indicates a sideways trend on the daily chart. The buyer’s signal line (green) and the seller’s line (red) are overlapping.
Support levels: $0.0940 and $0.0660
Resistance levels: $0.0.1475 and $0.1920.
