Weekend pump just a bull trap?
Cardano (ADA)
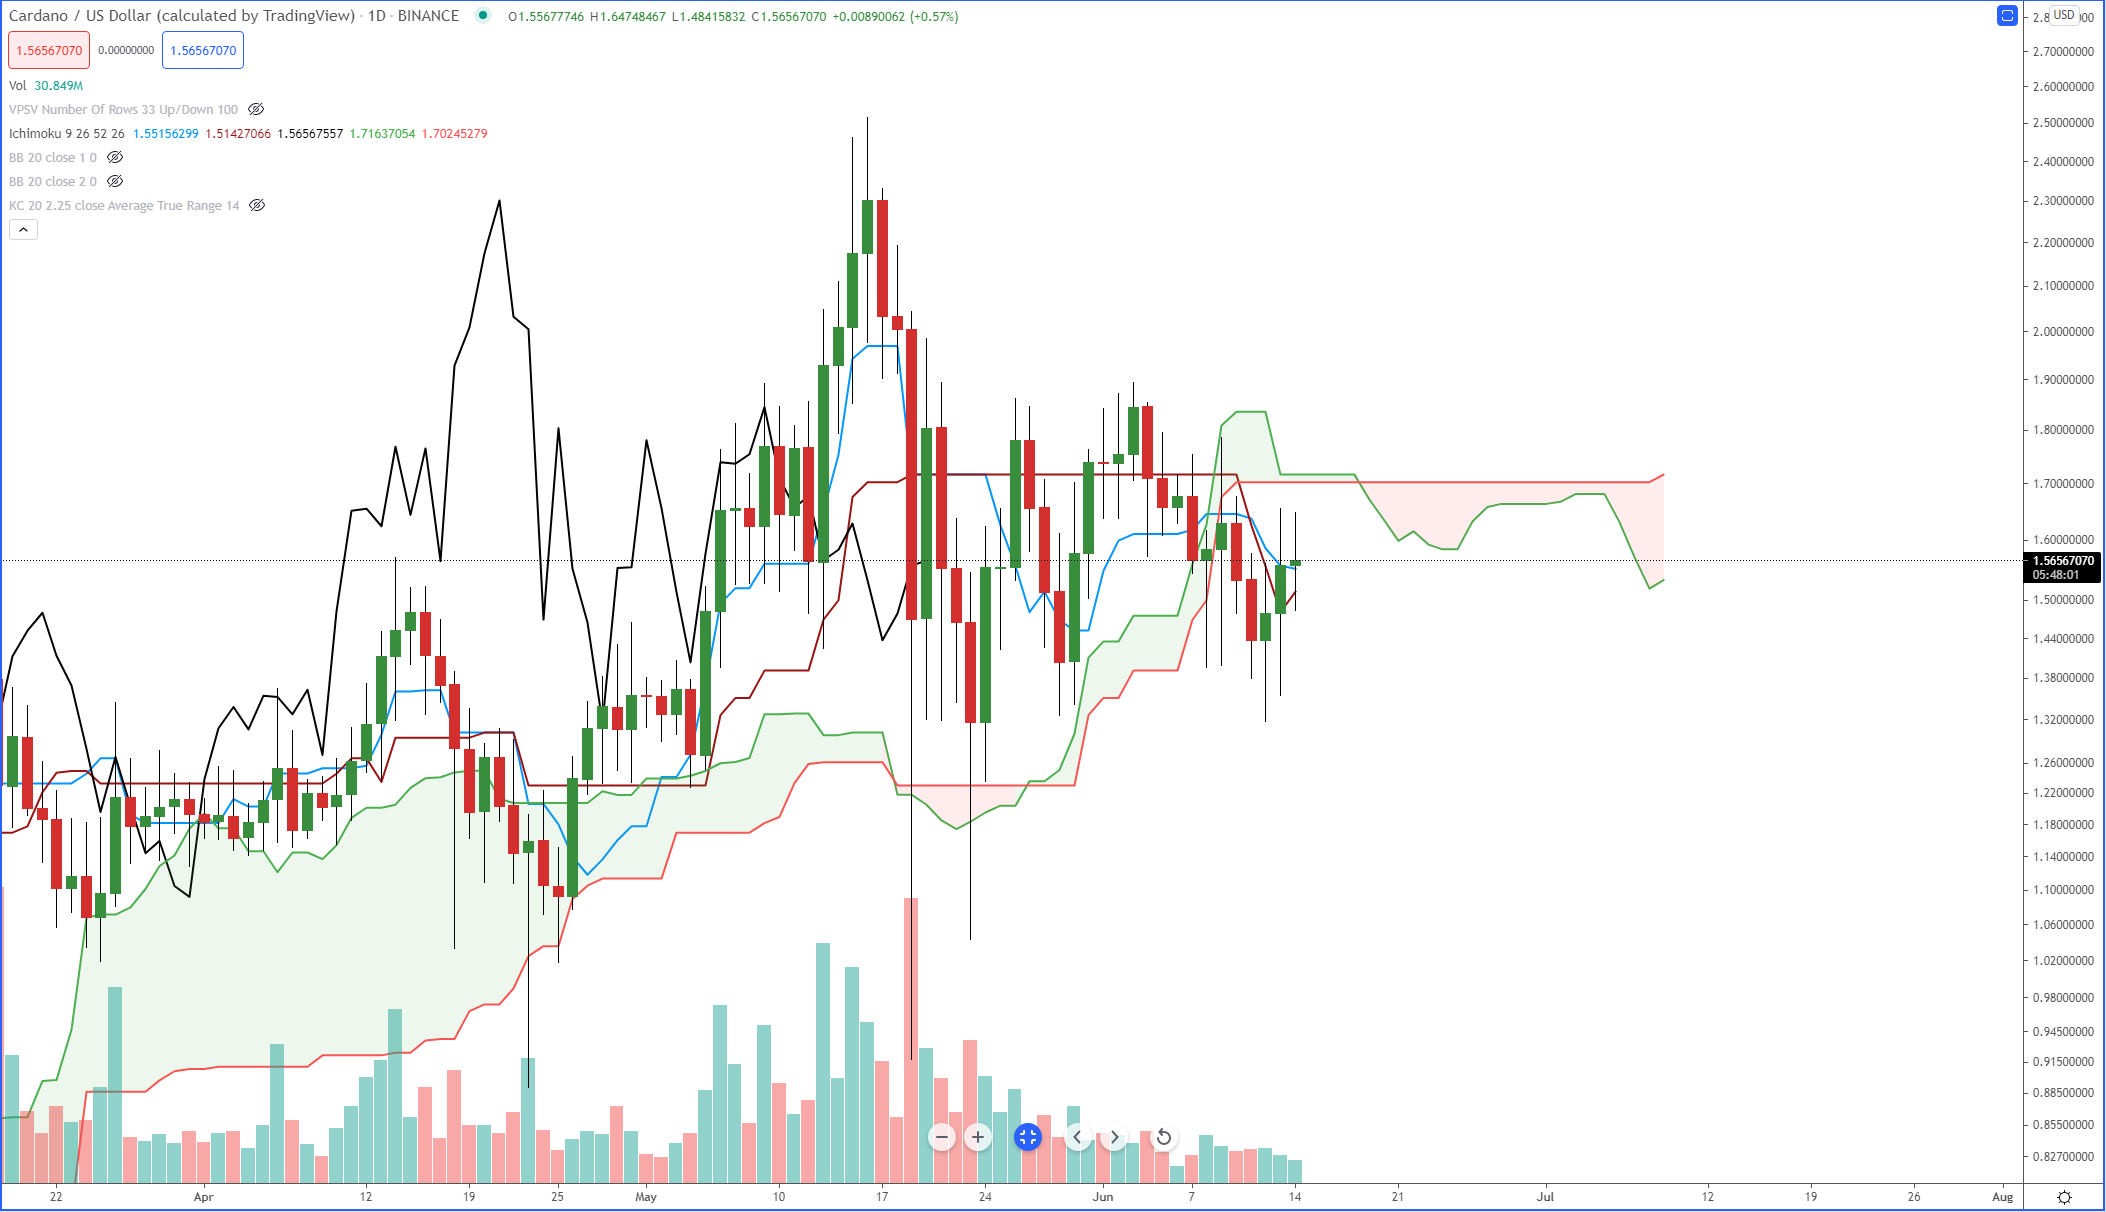
Above: Cardano (ADAUSD) Chart
Saturday and Sunday showed some impressive rallies across the cryptocurrency space. This extended into the Monday trading session when many crypto currencies smashed above 5% or more – but there’s been a pause and a retracement of those moves. At the time or writing this article, Cardano has been up almost 6% on the day, but has now retraced all of those gains and looks like it could turn negative. At the present, the daily candlestick for Cardano is an inside bar, which gives traders like me a clear idea of where to enter a long and short target. Inside bars are some of my personal favorite setups. If the current Monday high of 1.647 remains the high for Cardano, then I would normally consider taking some long positions. However, that price level is right up against a very flat Senkou Span B and I have no interest in buying there. The short side looks like it has more room and less risk, so of the current daily low of 1.484 remains, then I might consider some shorts.
Polygon (MATIC)
Above: Polygon (MATICUSD) Chart
Polygon has an interesting setup on its daily chart. First, Polygon has experienced a nice run higher since the weekend, but its been halted against two powerful resistance levels that now whare the same value: the Kijun-Sen and Senkou Span B are on top of one another. That price level is right where the current daily high for Polygon was found. Initially, this looks very much like a bull trap, but if you look to the left and to see where the Chikou Span is at, there is a long play in the card. Polygon’s chart is very different now when compared to its peers. If Polygon wanted to go full blown bull market mode, then its path to those bullish conditions is significantly easier than almost every other cryptocurrency. If Polygon were to close at the 1.84 value area, that would put the Chikou Span above the candlesticks as well as price above the Kumo. Almost all of the conditions for a bullish Kumo Breakout strategy buy entry would be complete if Polygon closed at 1.84.
ChainLink (LINK)
Above: ChainLink (LINKUSD) Chart
Take a look at the slope of ChainLink’s daily Kijun-Sen: it’s the opposite of a moon shot, it’s falling off a cliff. The angle of that slope has acted as the major resistance level for ChainLink during the day’s trade. There might be some hope of higher prices if ChainLink can close above the daily Tenkan-Sen, but that appears unlikely. Additionally, the Chikou Span remains below the daily candlesticks and if its going to remain in that state, it will need to close below the 19.90 value area on Thursday in order to maintain a push lower. There is a high volume node at 22 that if broken, could easily push ChainLink down to the 13 to 20 value area. The volume profile is very thing between 22 and 18. Watch for an sustained push below the 22 value area.
Advertisement
Save money on your currency transfers with TorFX, voted International Money Transfer Provider of the Year 2016 – 2020. Their goal is to connect clients with ultra competitive exchange rates and a uniquely dedicated service whether they choose to trade online or over the telephone.
Find out more here.


