- Chainlink witness good buying interest below the 200-day moving average (MA), but the 50-DMA is continuously acting as a hurdle
- The coin over the monthly time horizon is trading near the resistance zone of 20, 50, and 100-DMA with good volume action
- The pair of LINK/BTC is surged nearly +13%, standing at 0.0008329 BTC, whereas the LINK/ETH is CMP at 0.01159 ETH gains over +3.24% in the past 24-Hours
Chainlink monthly chart highlights the excellent buying or accumulation interest below the 200-Day moving average (MA). On the higher side, the digital asset is facing strong rejection from the short-term moving average of 20 and 50-Day.
The volume action is increasing drastically over the monthly chart, and the volume is above the average line. Similarly, the crypto asset must close above all SMA of 20 and 50-day for the significant recovery in the upcoming trading sessions. Support on the lower side is at $25.50 and $15.90; likewise, resistance on the higher side is $35.30 and $44.40.
Chainlink is Gradually Heading Towards the Supply Zone
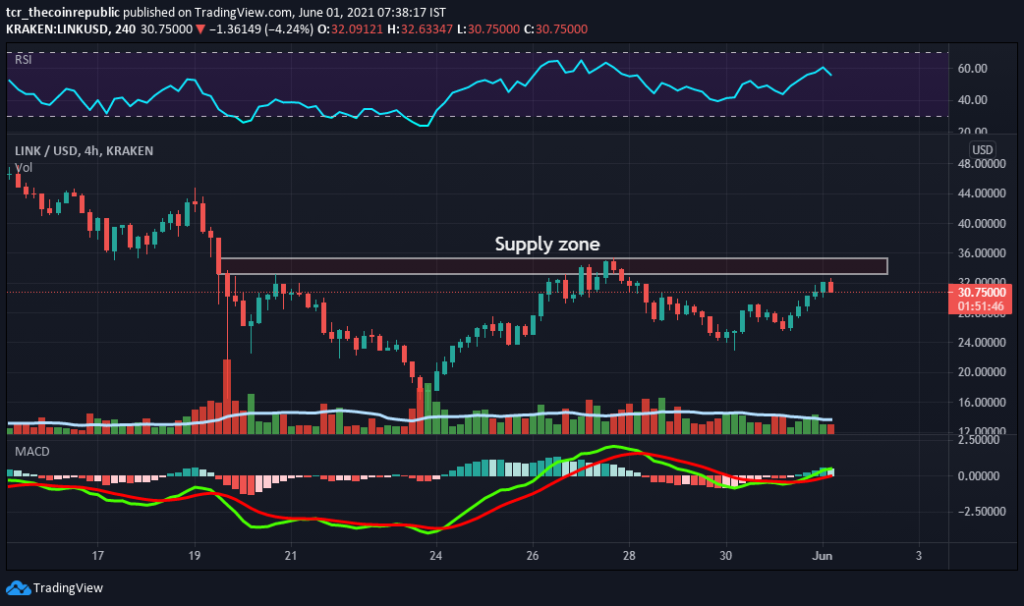
Chainlink is gradually heading towards the supply zone, and closing above the supply zone will boost the confidence of buyers or bulls. The technical parameters indicate mildly positive momentum, but the critical area to watch is $33-$35.20. Presently, the coin is trading at $30.75 with intraday gains of 20% and the volume to market cap ratio of 0.1932. Whereas the volume in the last 24-Hours jumped over +23%, standing at $2,570,861,536. Similarly, the digital asset is standing at 12th position according to coinmarketcap.com, with a value of $13,190,947,683.
Relative Strength Index (NEUTRAL): Chainlink RSI is presently projecting sideways or range-bound momentum over the weekly chart.
Moving Average Convergence Divergence (NEUTRAL) currently indicates a sideways trend on the daily chart. The buyer’s signal line (green) and the seller’s line (red) are overlapping.
Support levels: $25.50 and $15.90
Resistance levels: $35.30 and $44.40.