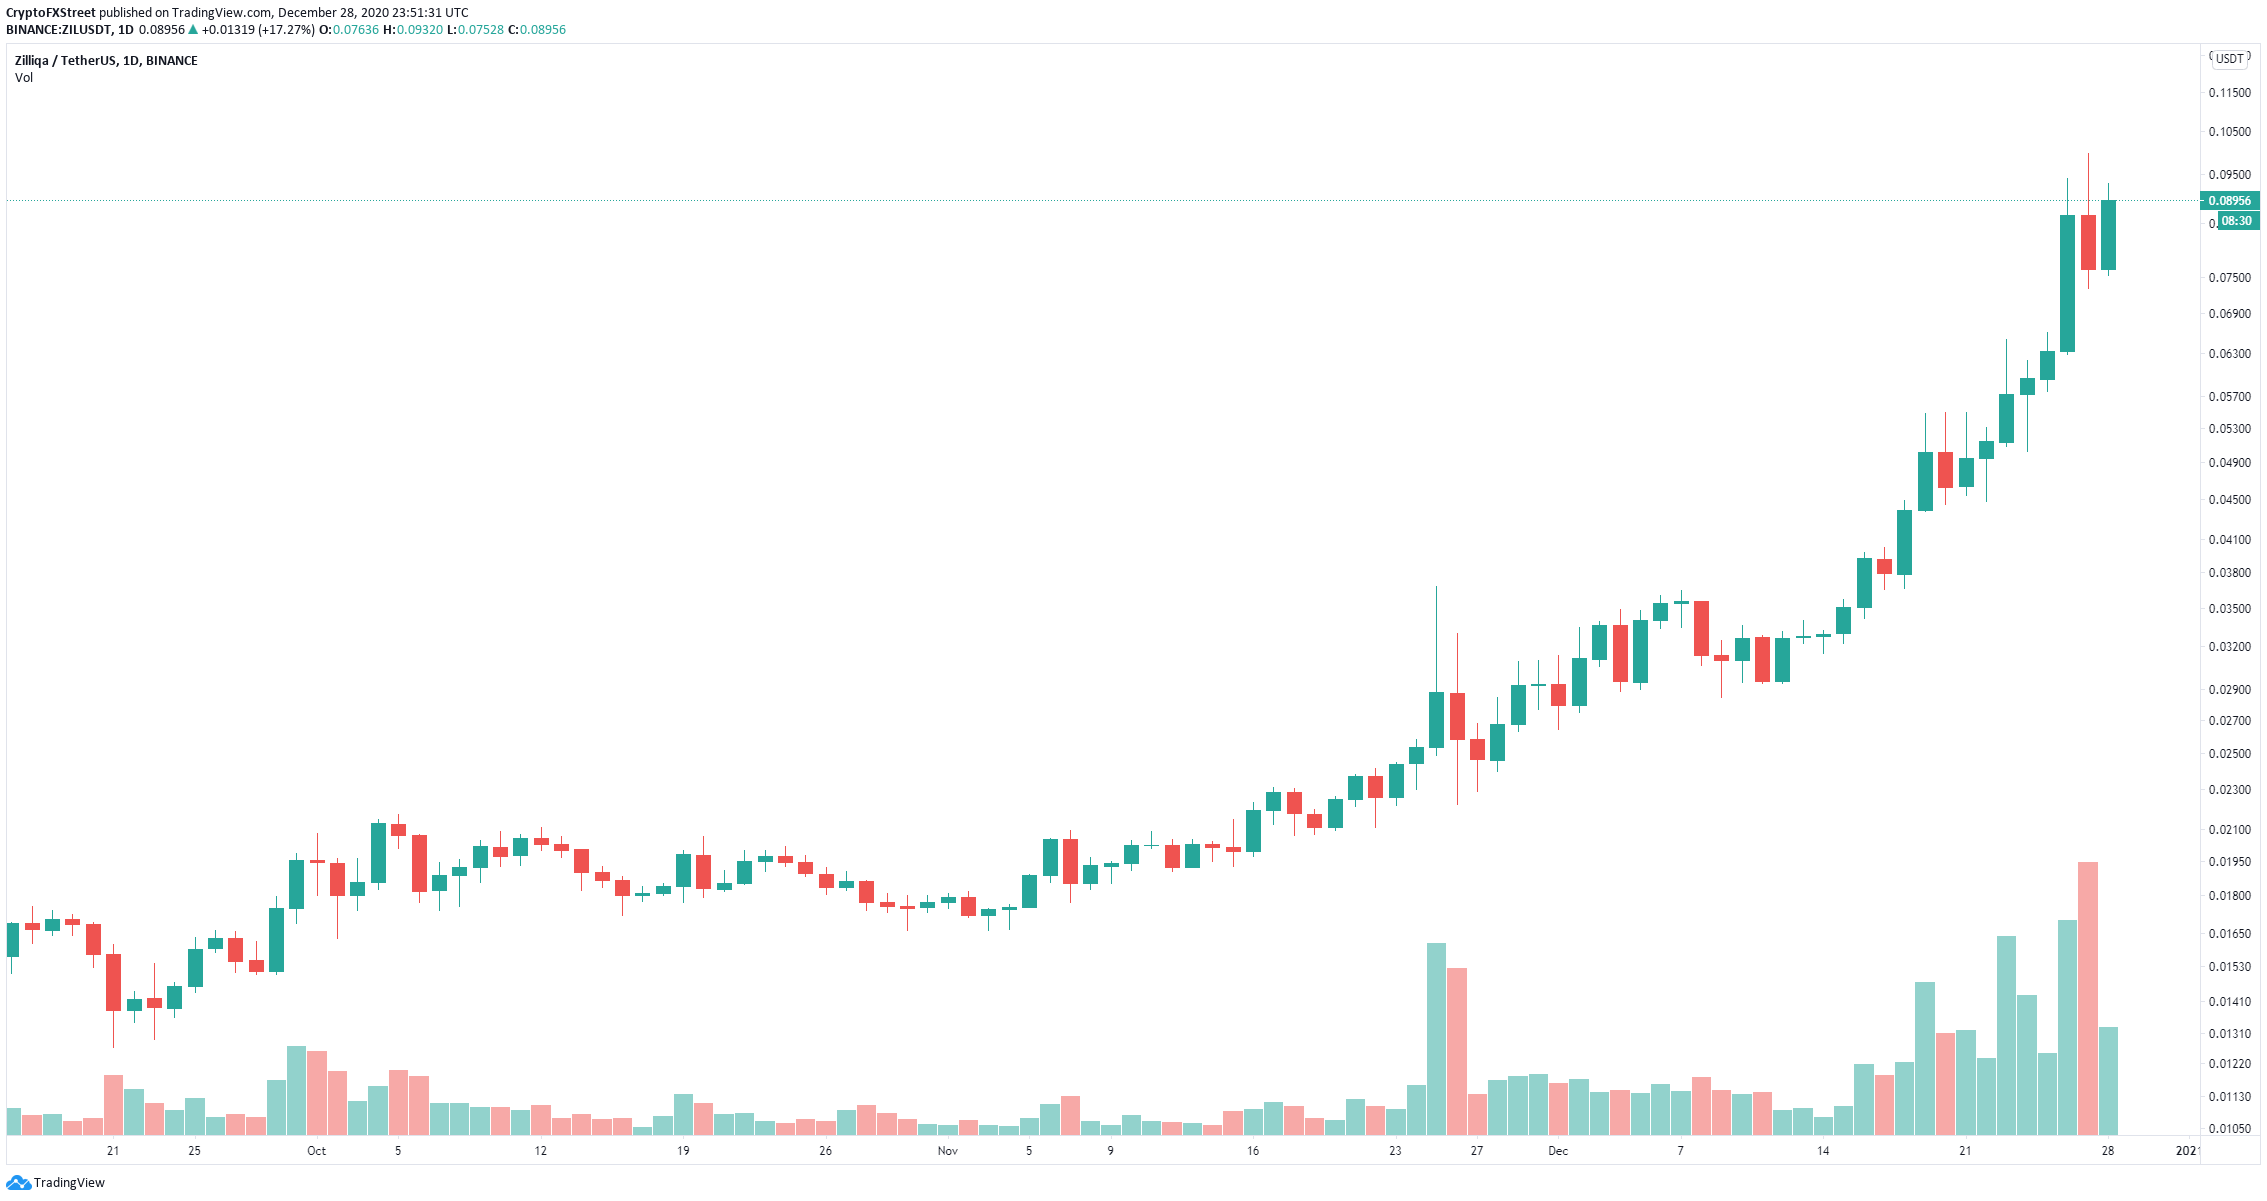
- Zilliqa price is up by more than 60% in the past few days.
- The digital asset has been trading inside a robust uptrend hitting new highs almost every day.
Zilliqa by around 500% since the beginning of November and hasn’t shown many bearish signs just yet. However, some technicals are suggesting that the digital asset might be poised for a significant correction in the short-term.
Zilliqa price could see a strong pullback down to $0.06
Although not 100% confirmed, the TD Sequential indicator seems to be on the verge of presenting a sell signal on the daily chart and the weekly chart. The indicator has presented a green ‘8’ candle on both charts which is usually followed by a green ‘9’ sell signal. If both are confirmed, they can push Zilliqa price down to $0.06, the 12-EMA on the daily chart.
ZIL/USD daily and weekly charts
The social volume of Zilliqa, which measures the mentions of the digital asset on different social media platforms, peaked right before the last sell-off on December 27. This number is increasing again which hints at another potential pullback, giving more credence to the bearish outlook presented above.
ZIL/USD daily chart
However, despite the several bearish signs, the daily uptrend remains intact. The digital asset is facing very little resistance to the upside as these prices haven’t been seen since June 2018.

