- Zilliqa price is up by 162% since November and almost 2,000% year-to-date.
- The digital asset might be poised for a short-term correction, according to a critical indicator.
Zilliqa has been trading inside a robust uptrend on the daily chart since November and has outperformed Bitcoin in the past week, gaining almost 50% and hitting a new 2020-high at $0.0434.
Zilliqa faces a short-term correction
On the 12-hour chart, the TD Sequential indicator has just presented a sell signal which has proven to be extremely accurate in the past leading the digital asset into 15-20% corrections.
ZIL/USD 12-hour chart
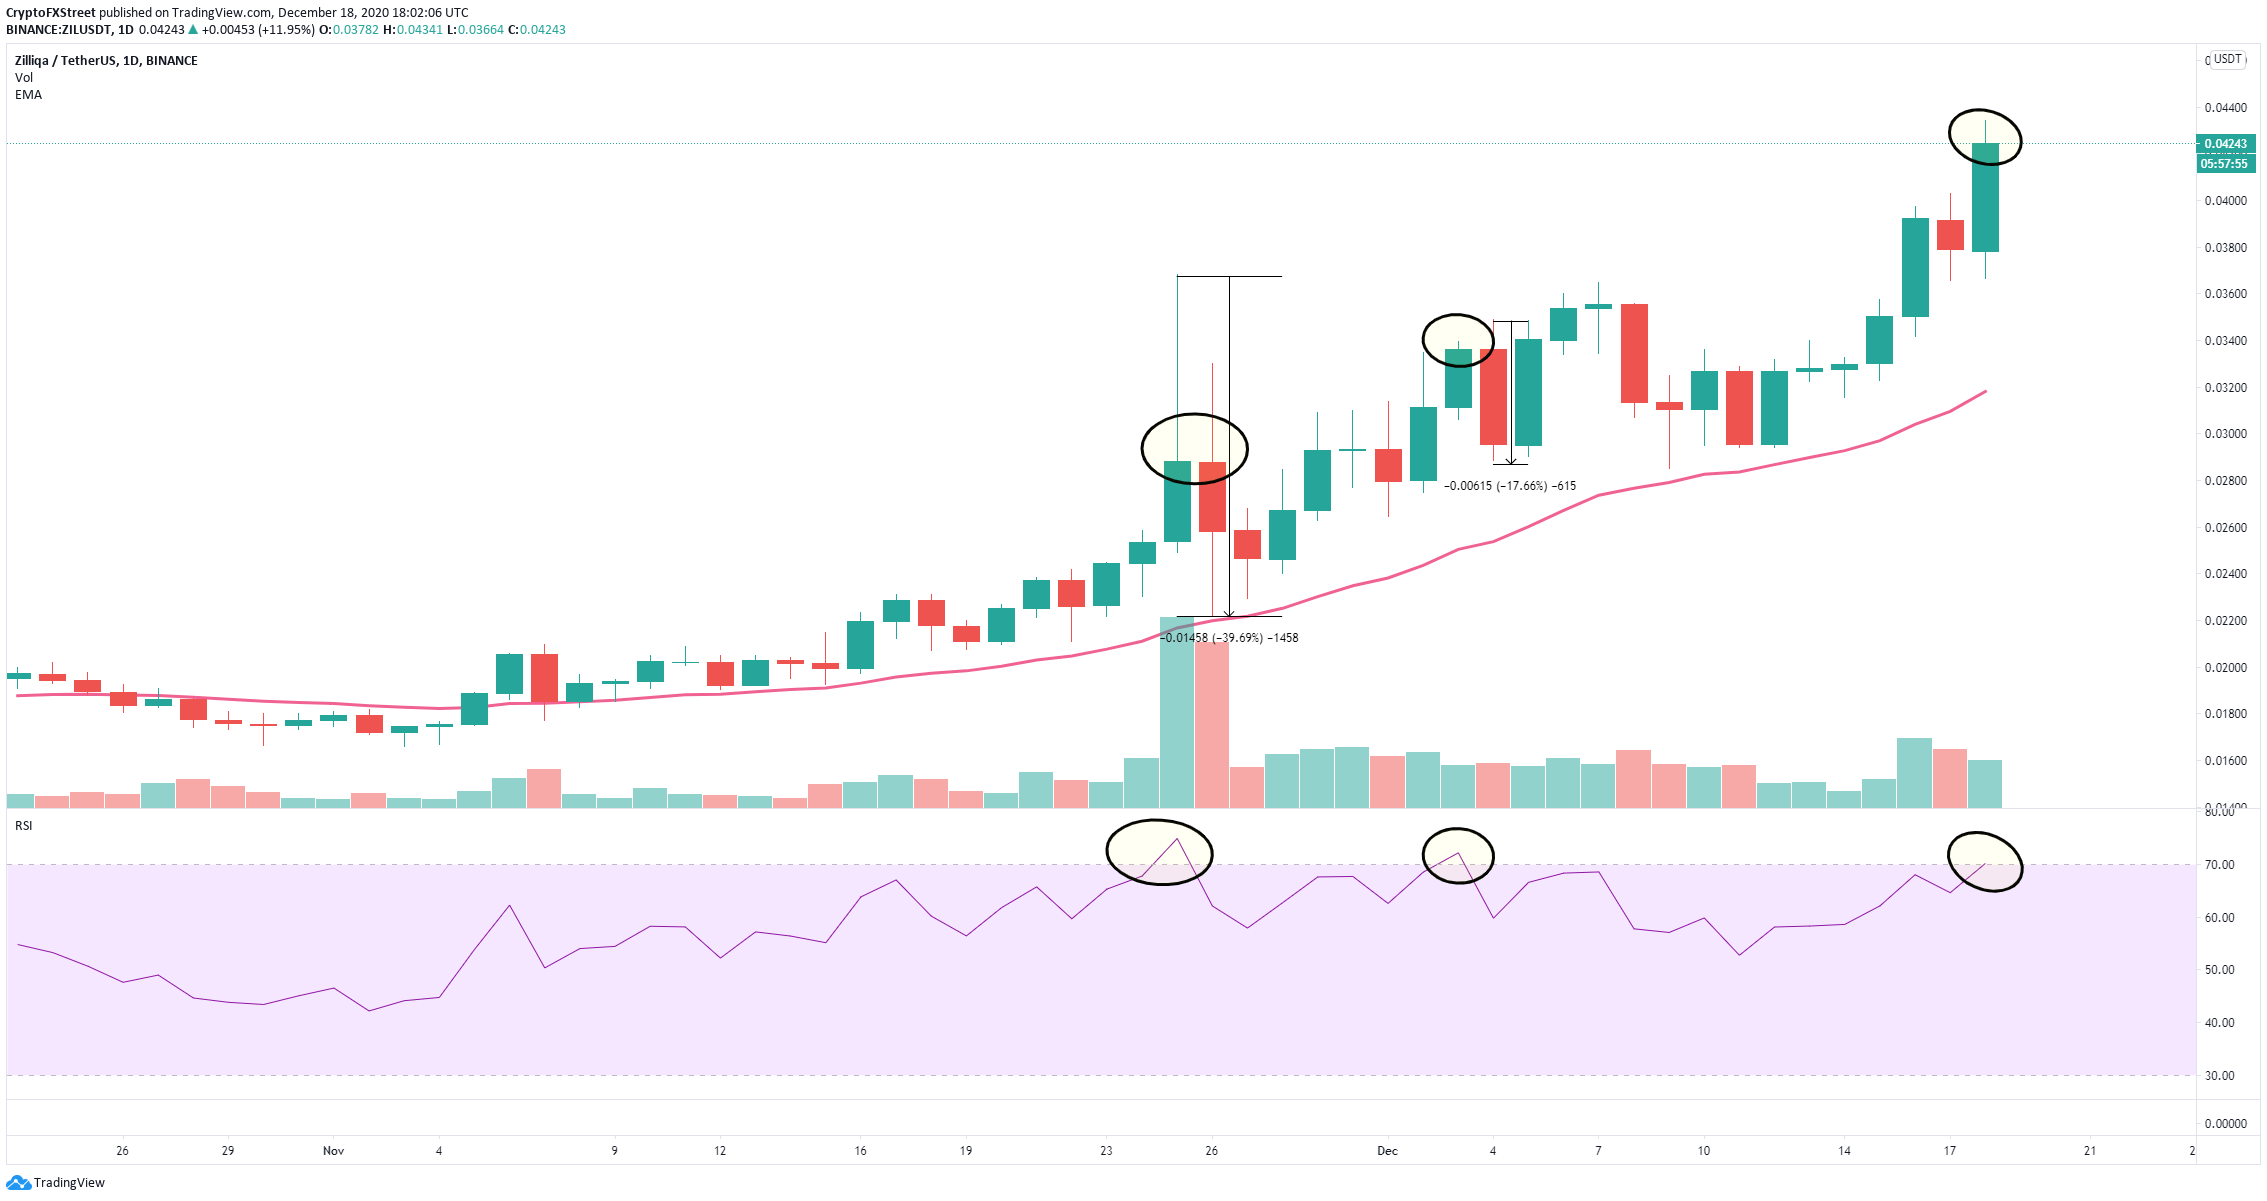
Additionally, on the daily chart, the RSI has reached overextended levels again which has also been an accurate indicator in the past of upcoming pullbacks. The last two times, Zilliqa price dropped by 39% and 17% respectively. Another correction could lead the digital asset towards the 26-EMA at $0.032.
ZIL/USD daily chart
However, as there is very little resistance on the way up and bulls have defended the 26-EMA support level for a long time, Zilliqa price could simply continue surging higher, targeting the psychological level at $0.05.

