Theta takes pride in being the crypto token that powers the delivery of the next-generation video. On its website, co-founder Steve Chen says the crypto token aims to disrupt the online video industry, like YouTube did to the traditional video in 2005.
Launched in 2019, Theta demonstrated strengths, rising to a record of over $16.000 in April before the crypto plunge took it back to the low of around $3.54 on July 20.
The meteoric rise of THETA/USD has been attributed to its growing use case, with online video streaming gaining popularity during the pandemic.
Forbes expects video games to be a $300 billion industry by 2025. With the growing popularity of online video games, Theta represents a viable crypto project.
Let’s look at how Theta has been doing lately
On Wednesday, July 21, Theta bounced off from its low of over four months, at $3.535, gaining more than 8%. A spot-check showed that almost all other cryptocurrencies had gained, but few managed a pullback similar to that of Theta.
The jump in the Theta token happened after prices showed a lot of indecision around the $3.549 support, generating potential clues of a possible upside.
But, how long can Theta sustain the potential bullish run it is currently developing?
THETA/USD – A Technical Outlook
Theta 4HR Chart Analysis
Observed on a 4-hour chart, Theta tested the support around $3.549 before prices bounced back.
It should be noted that $3.549 is a crucial make-or-break level for Theta. It traded at the same price level before making the solid bullish rally to a record high in March. See the daily chart below:
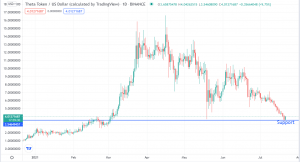
Theta Daily Chart Analysis
The 4-hour THETA/USD chart is providing clues to a potential bullish momentum. However, prices remain trapped on the bearish trendline and a descending triangle, which is acting as support on the 4-hour and daily charts.
THETA/USD Trade Idea
I view the quick bullish jump in the price of Theta from major support as a potential price reversal. However, I would be keen to know whether the price is going to break the bearish trendline and violate the descending triangle setup for a potential buy trade.
A buy trade should target the $5.874 level, as it is a major resistance/support. However, profits should be taken around $4.388 and $4.78, which have acted as market-event areas before.
Nonetheless, further weaknesses are possible, given the broader crypto weaknesses. I am keen on the $3.5464 support, and a further break below this level could open the area around $2.7333 as my next target for a sell trade.
For now, I recommend traders stay on the sidelines, as they await trade confirmations based on the technical analysis above. Good Luck!