- Zilliqa price had a breakout from a descending triangle pattern on the 4-hour chart.
- The digital asset faces a robust resistance level at $0.20.
- Bears aim to push ZIL towards a low of $0.16, but there is a lot of support on the way down.
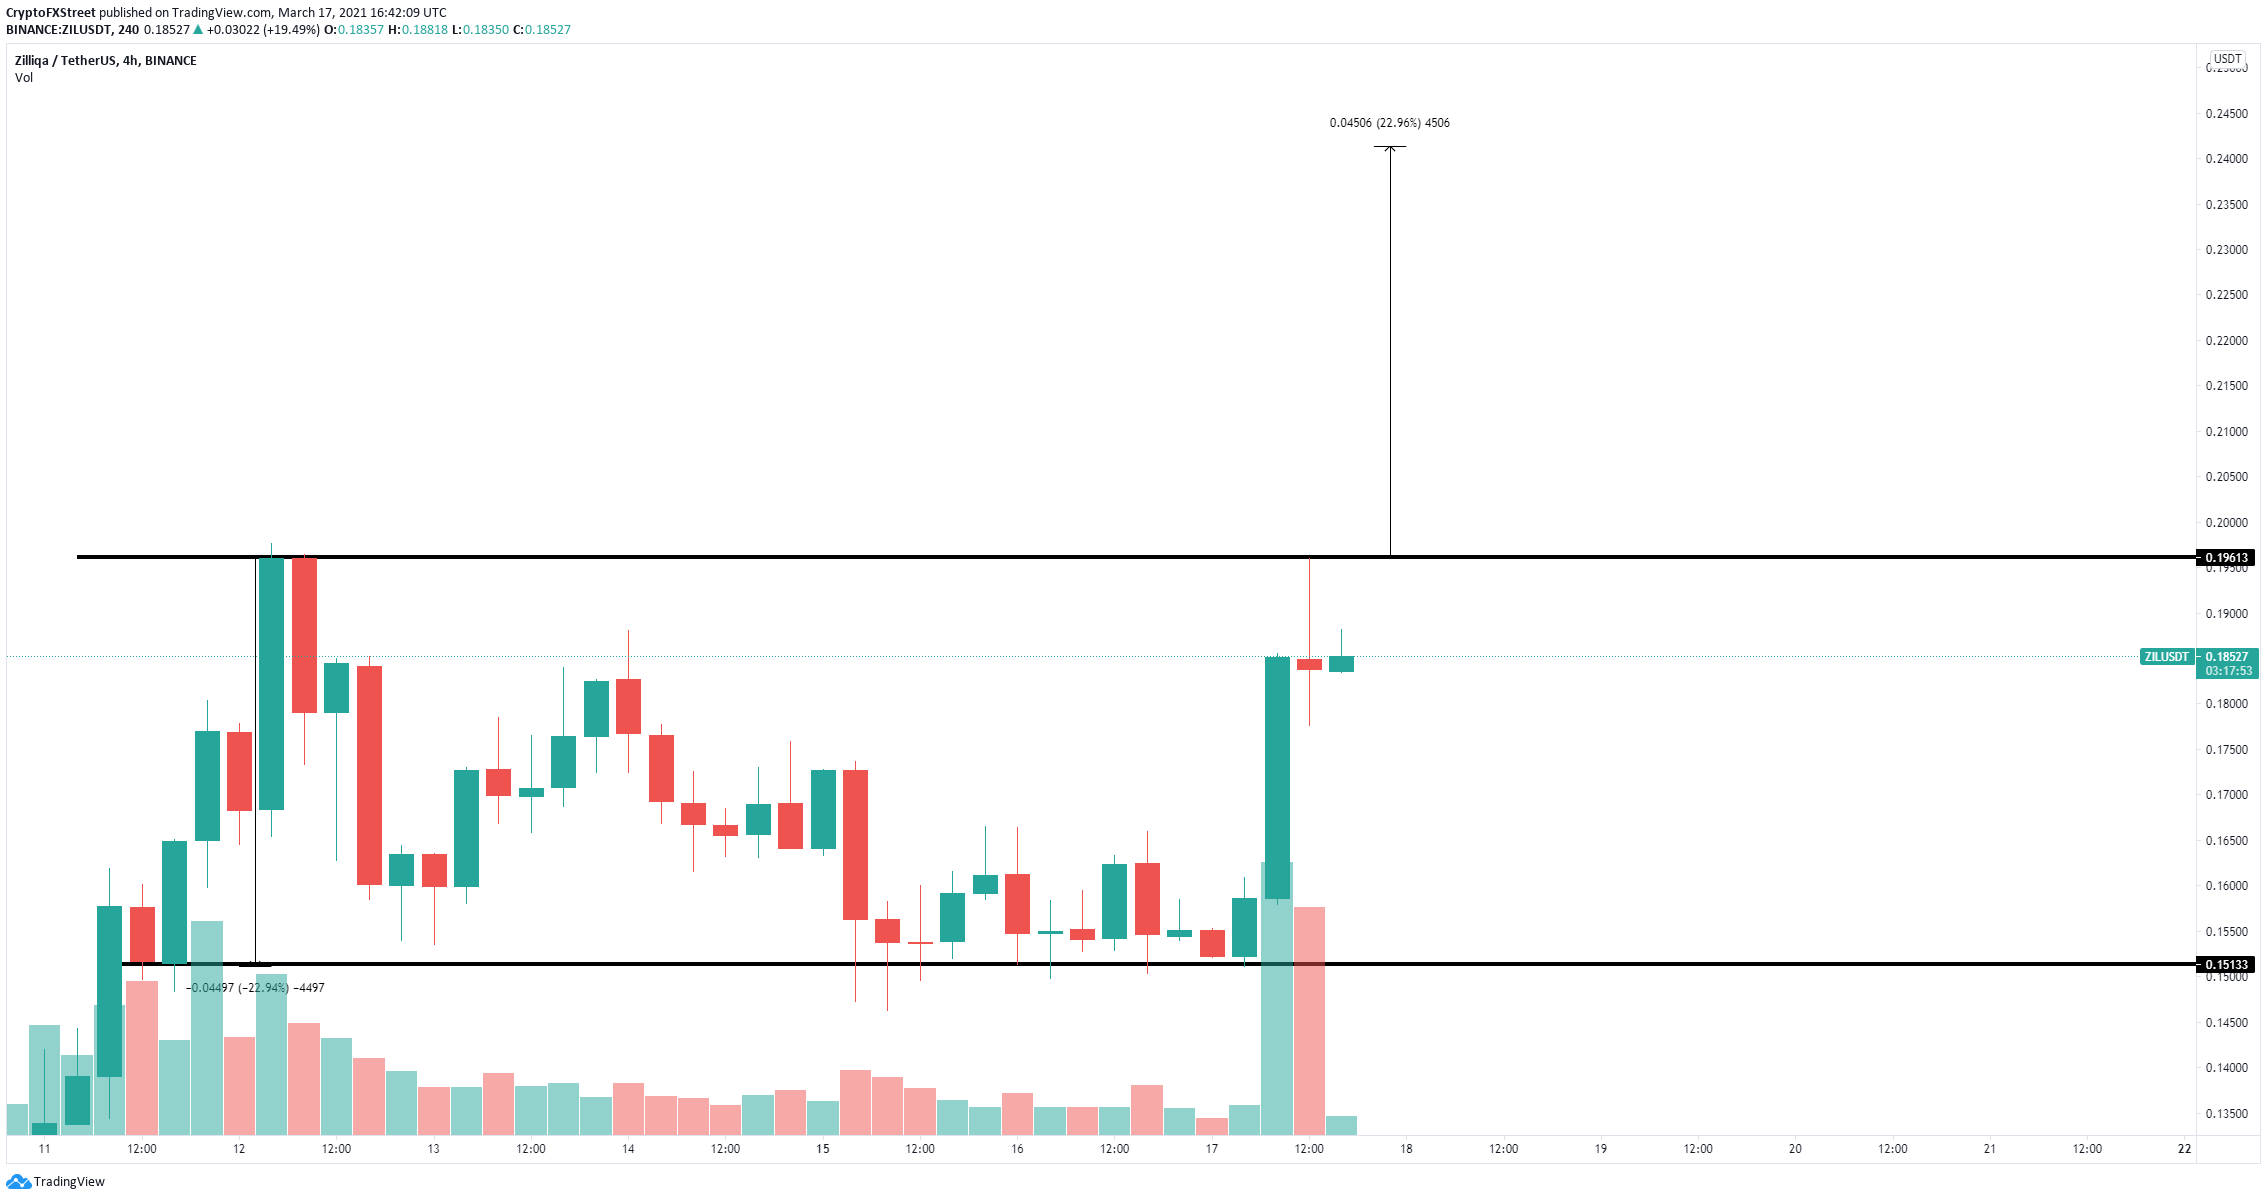
Zilliqa had a major 23% breakout from a key pattern on the 4-hour chart and quickly reached the price target of $0.195. Now the digital asset is primed for a healthy correction period which could lead ZIL into a new leg up above $0.20.
Zilliqa price needs to see a pullback first before new highs
On the 4-hour chart, the breakout of the descending triangle pattern had a target of $0.195, which was instantly met. The previous resistance level of $0.20 rejected Zilliqa, indicating that the digital asset might be poised for a stronger correction.
ZIL/USD 4-hour chart
On the way down, bulls have several support levels to hold on to, the first located at $0.173 and the second at $0.166, which closely coincides with the 26-EMA. Losing both levels would drive Zilliqa price down to $0.151.
ZIL/USD 4-hour chart
On the other hand, a breakout above the key resistance level of $0.20 should drive Zilliqa price up by 23% towards a high of $0.241.

