Key Takeaways
- Dogecoin continues to consolidate in a tight range that is getting narrower over time.
- A daily candlestick close outside of the $0.26 to $0.17 price range could determine its course.
- DOGE’s price history shows that bulls may have the upper hand.
Share this article
Dogecoin appears to be repeating the price action it has experienced since the beginning of the year. Although the buying pressure is not high enough for DOGE to break out, several on-chain metrics can help anticipate the asse3t’s next significant price movement.
Dogecoin Remains Stagnant
Dogecoin’s fate is resting on two key metrics.
The original meme cryptocurrency has had a memorable year. It reached a new all-time high of $0.74 in early May during a period of frenzy across the market. The asset has a year-to-date return of 4,500% despite the low volatility it has seen in the last few months.
DOGE’s daily chart shows that it often consolidates for extended periods before breaking out. These stagnation periods are characterized by the formation of descending triangles that result in exponential price movements.
For instance, Dogecoin developed this type of technical pattern for 26 days before surging by 936% in late January. Similar price action took place in early April after the asset had consolidated for two months.
Now, the tenth-largest cryptocurrency by market cap appears to be developing the same bullish continuation pattern. Dogecoin’s price has made a series of lower highs since early May, while the $0.17 support level is preventing it from a steep correction.
Slicing through the descending triangle’s hypotenuse at $0.26 could kickstart an exponential price movement towards new all-time highs.
Bullish Signs to Monitor
Some of the most significant price movements Dogecoin has enjoyed throughout the year have been boosted by celebrity endorsements. Such behavior suggests that retail interest must increase for DOGE to advance further. Still, some key on-chain metrics can help determine whether buying pressure is accelerating.
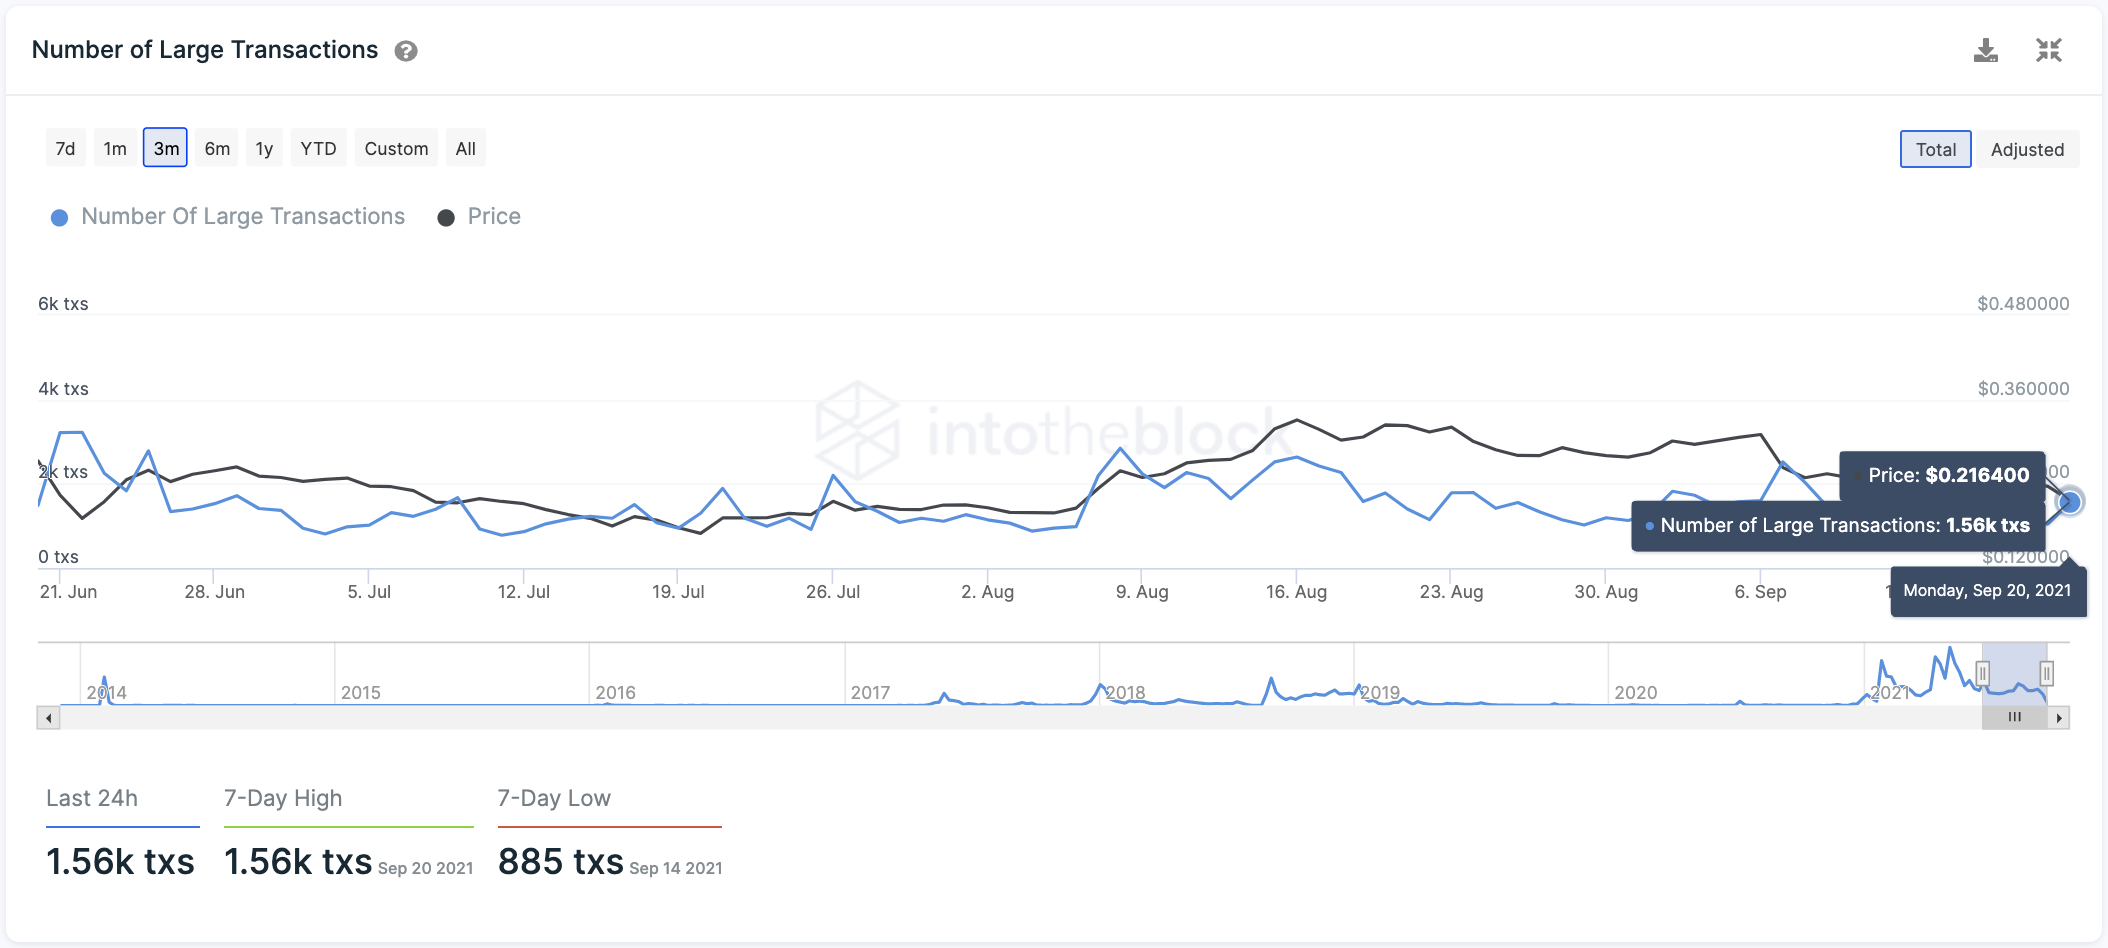
The number of large transactions on the network with a greater value than $100,000 can act as a proxy to institutional players’ and whales’ activity. A significant increase in large transactions could indicate that wealthy investors are beginning to position themselves for a new bull run.
Currently, 1,560 large transactions are being executed on the Dogecoin network. The number of large transactions hit a high of 2,520 on Sep. 7; a 38% increase could suggest that whales are starting to take control of the price action.
If this metric starts to record a series of higher highs, the odds would favor the bulls.

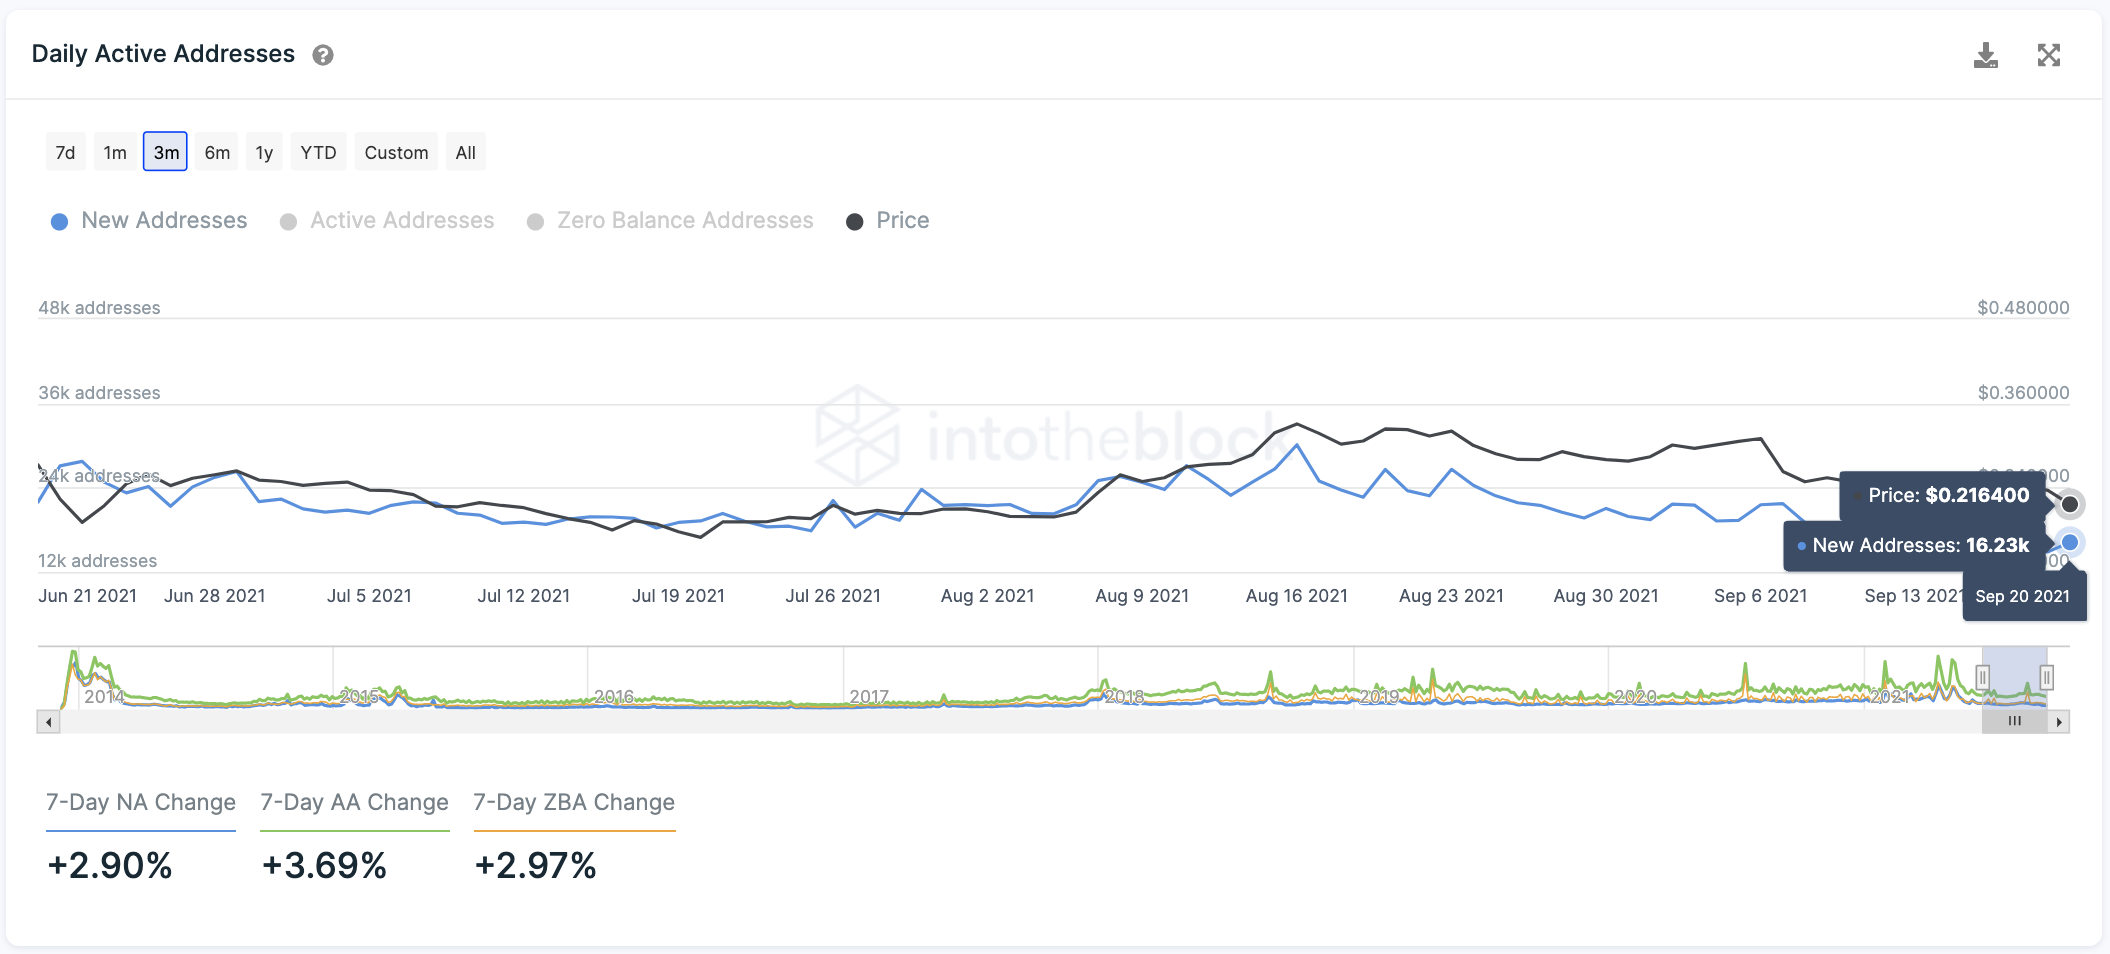
It is also crucial to pay attention to the number of new daily addresses created to determine if retail investors are joining the network.
Network growth is often considered one of the most accurate price predictors. Generally, a steady increase in the number of new addresses created on a given blockchain leads to rising prices over time.
A new high of 22,000 new addresses joining the Dogecoin network per day could signal the beginning of a new uptrend. Under such unique circumstances, traders must wait for a higher high on this on-chain metric before entering any positions to confirm that buying pressure is accelerating.

While a spike in the number of large transactions and new daily addresses on the network would confirm the bullish outlook, a daily candlestick close below the symmetrical triangle’s x-axis at $0.17 would invalidate it. The transaction history shows that after losing such a critical support level, DOGE would face little opposition on its way down to $0.08.
Share this article
Dogecoin Creator Billy Markus Is Auctioning a New NFT
Dogecoin creator Billy Markus has updated his “Crappy Dogecoin Doodles” by adding a new non-fungible token (NFT) to the collection. Crappy Dogecoin Doodles #5 Today, Markus announced the fifth token…


