- Ethereum price faces the 8-day EMA at $1,131, which has rejected the recent bullish attempt to move higher.
- Investors can expect ETH to head up to $1,500 if the aforementioned level is overcome.
- A daily candlestick close below $993 will shake buyers’ confidence and invalidate the bullish outlook.
Ethereum price has been hovering around a significantly important resistance barrier. This key level prevented ETH from climbing higher in the recent rally. However, things might change soon for the smart contract token, which could result in a quick run-up.
Ethereum price ready for another move
Ethereum price seems to be turning over a new leaf as seen on the daily chart. After creating a lower low on June 18 at $878, ETH rallied 35% and created a swing high at $1,192. While this recovery was impressive, the altcoin is looking to set a higher low, suggesting that a full-blow recovery could be in play.
Invest can expect Ethereum price to trigger a run-up to $1,543, the immediate resistance barrier if it can overcome the 8-day Exponential Moving Average (EMA). This level has been a hindrance for ETH since its recent breakdown on June 1. Any attempts after this development have failed to propel ETH price higher.
As a result, clearing this hurdle will indicate that the bulls mean business and will likely catapult Ethereum price up by 42%. Here, the 34-day EMA coincides with the $1,543 hurdle, making this confluence the upper limit for ETH.
ETH/USDT 1-day chart
Capitulation or more woes?
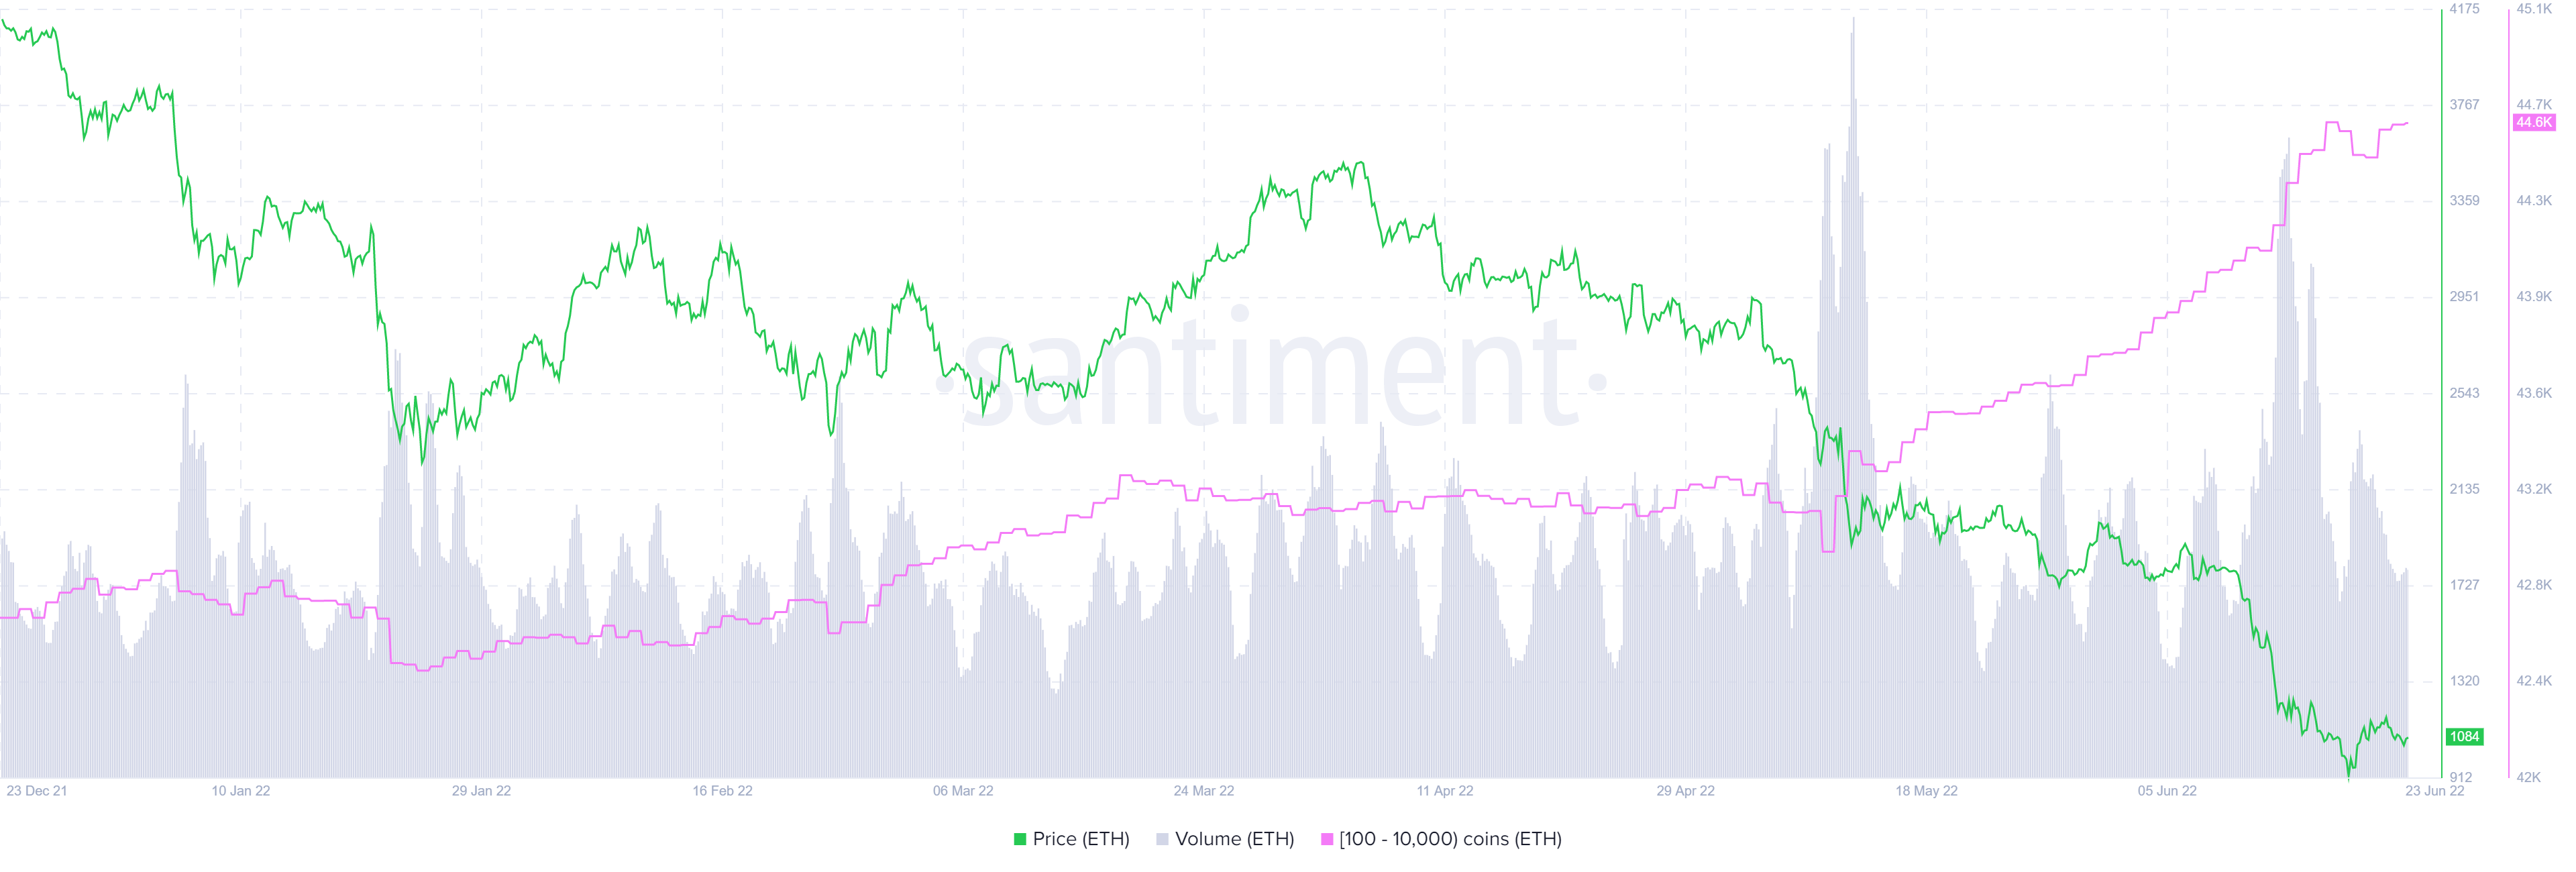
Supporting this bullish outlook for Ethereum price is the steady incline in the number of investors holding between 100 and 100,000 ETH, which has increased from 44,100 to 44,600 between June 9 and June 23.
Roughly 500 new addresses have joined the Ethereum blockchain, suggesting that investors could potentially be buying the dips.
ETH supply distribution
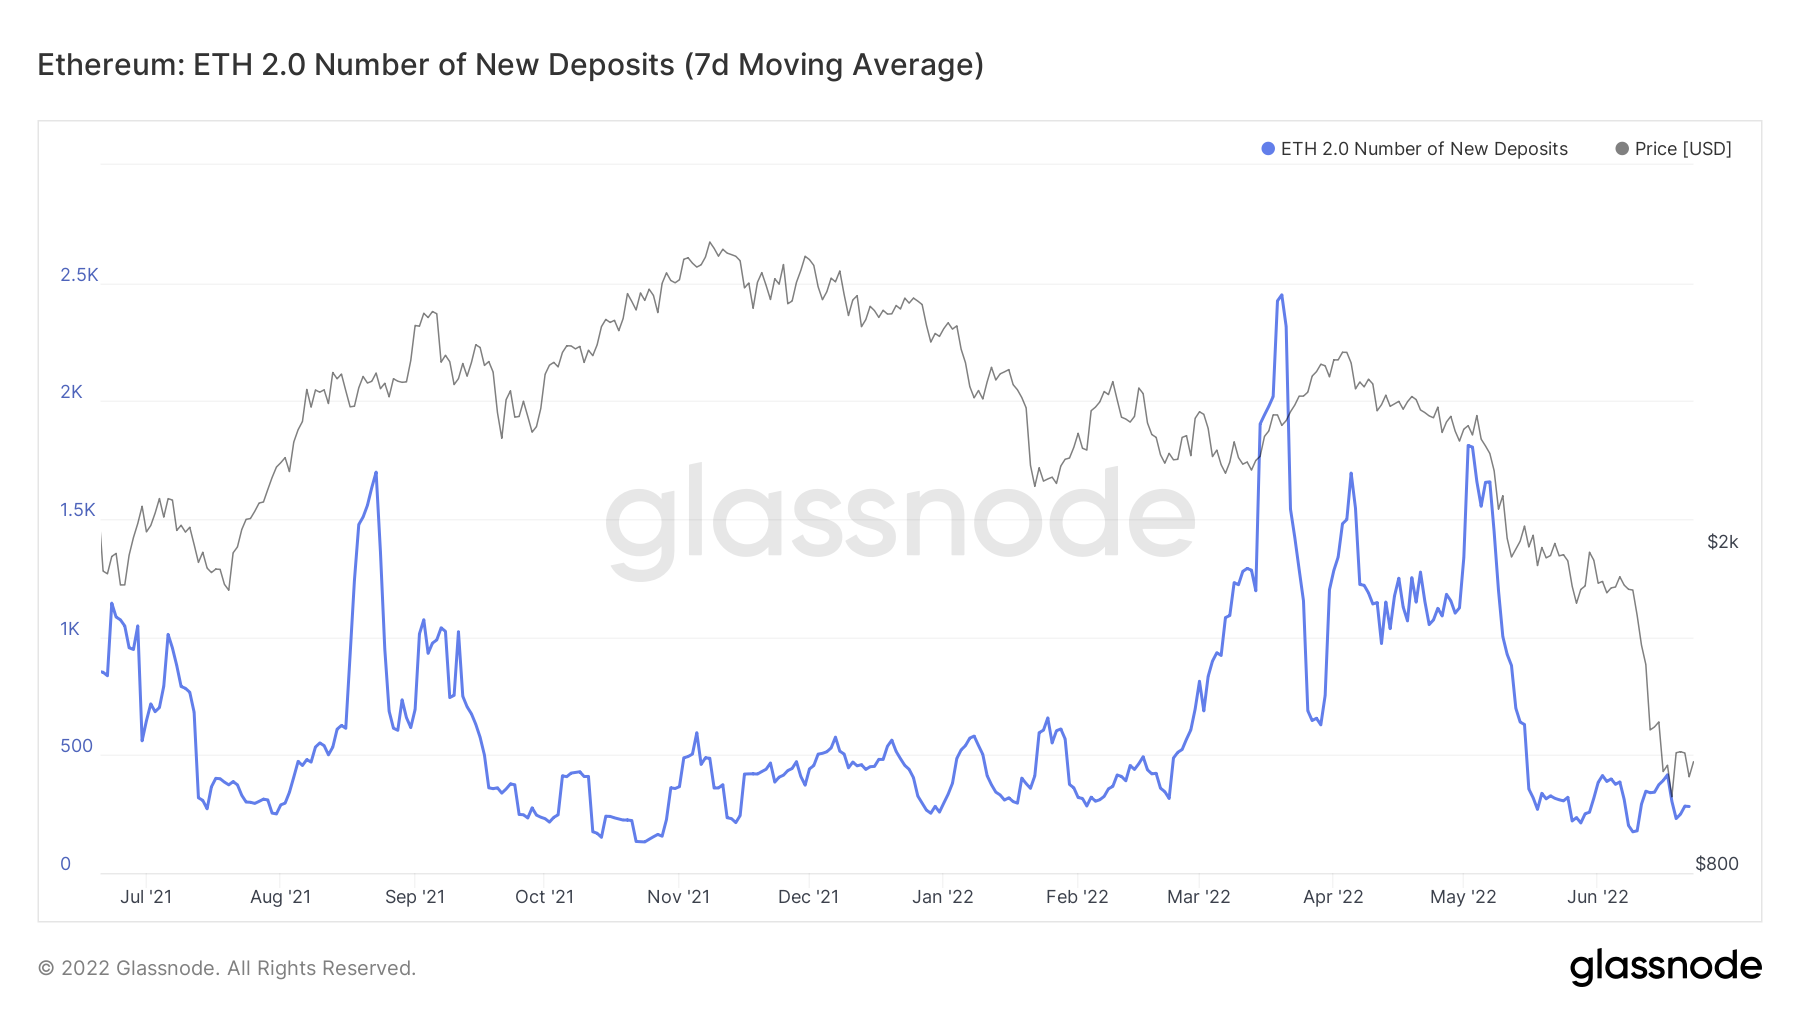
Further adding credence to a potential bottom for ETH is the decline in the number of deposits seen in the ETH 2.0 staking address. So far, roughly 12.0 million ETH has been deposited into this contract. However, the number of deposits has declined over the last two months.
On May 2, the deposits spiked to 1,811 ETH, but have since fallen to 283 as of June 23. This sharp decline in users interested in staking their ETH suggests that investors have been capitulating due to the recent crash in Ethereum price from $4,900 to $1,100.
ETH 2.0 staking deposits
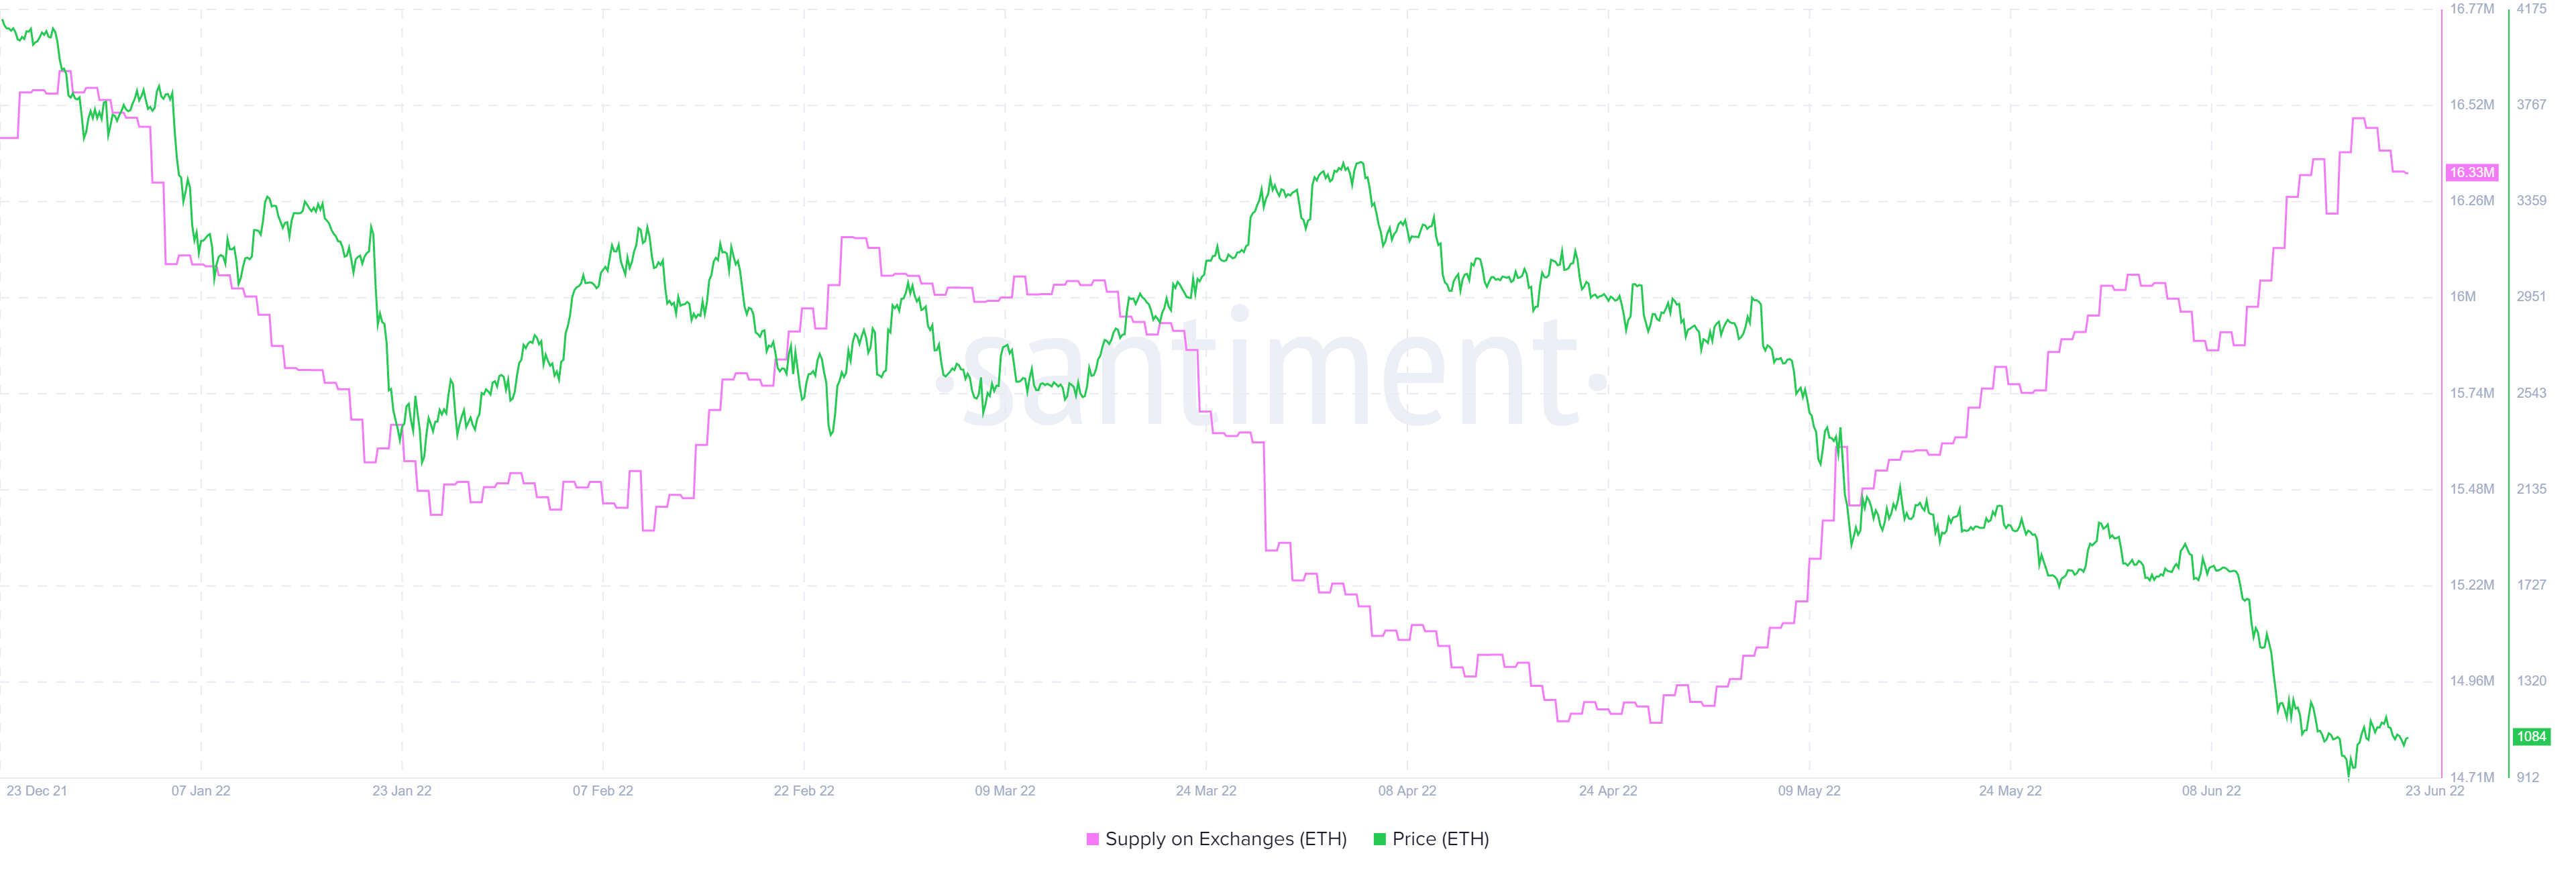
Adding a tailwind to the bearish scenario is the recent uptick in the amount of ETH held in exchanges from 15.87 million to 16.33 million. Roughly 460,000 ETH were sent to centralized platforms in under two weeks.
If Ethereum price were to suddenly take a small downturn, these investors could panic sell and add to the bearish momentum, resulting in a cascade. Therefore, despite the recent recovery, market participants should exercise caution.
ETH supply on-exchanges
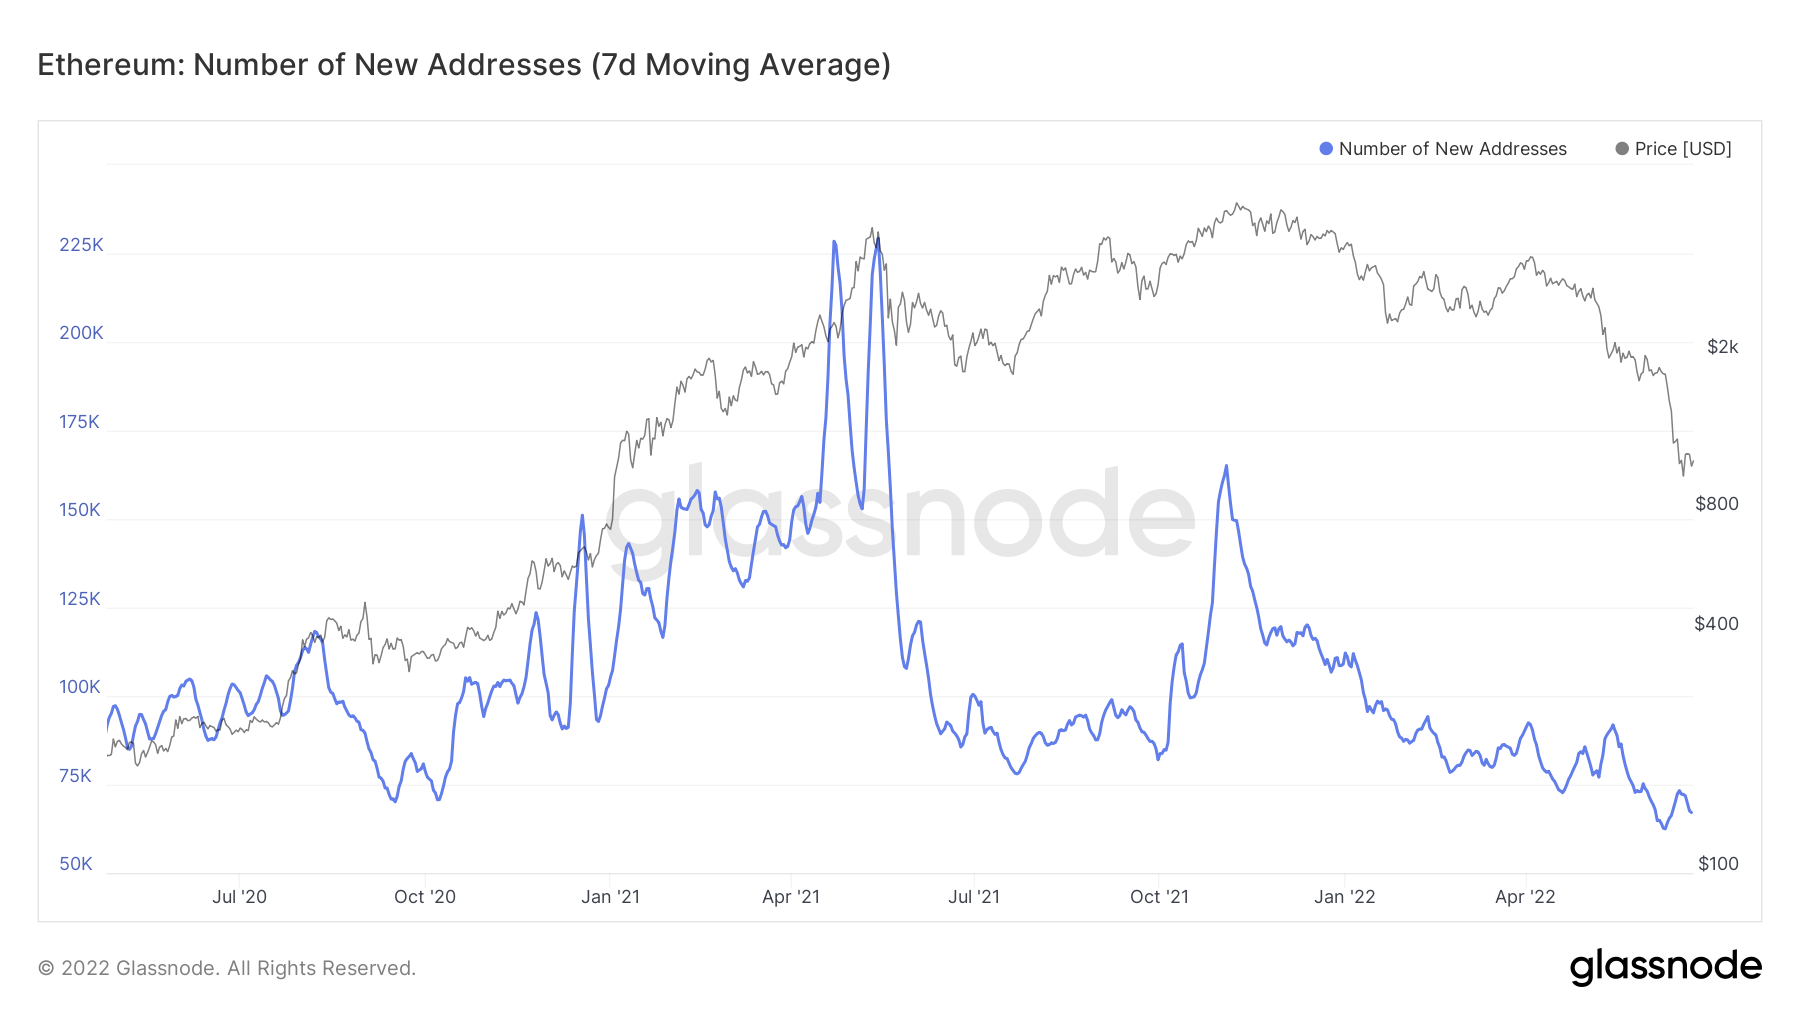
Lastly, the number of new addresses joining the ETH blockchain has also remained stagnant, indicating that investors are not keen on purchasing Ethereum at the current price levels. The 7-day moving average of this metric has reduced from 73,277 to 67,077 between June 16 and June 23, representing a net decline of 8.4%.
ETH new addresses
While the technicals are presenting a favorable outlook for Ethereum price, they are reliant on ETH overcoming the 8-day EMA at $1,131. Furthermore, the on-chain metrics are not painting a bullish picture and suggest the possibility of a further downtrend, at least from a macro perspective.
If Ethereum price produces a daily candlestick close below the $993 support level, it will create a lower low with respect to the candlestick close seen on June 18. Such a development will invalidate the bullish thesis and trigger a 12% correction to $878, the June 18 swing low. Here, buyers could regroup and give the recovery rally another go.


