Bitcoin Analysis
Bitcoin’s price has appreciated 18.17% over the last 6 days and bulls stepped up the demand again on Monday as BTC’s price closed its daily session +$558.4.
As usual we’re leading off our price analyses today with Bitcoin and today we’re looking at the BTC/USD 4HR chart below from FXCM. BTC’s price is trading between the 0.786 fibonacci level [$22,066.01] and the 1 fib level [$23,017.36], at the time of writing.
Bullish BTC market participants have seized momentum after retesting the $18k level only six days ago. Their targets above are the 1 fib level with a 100% retracement back to the $25k level as a secondary aim. That level is where bullish BTC market participants ran out of demand during the most recent local high nearly one month ago.
At variance with bulls are bearish traders that have targets to the downside of 0.786, 50.00% [$21,864.58], and 0.00% [$18,532.96].
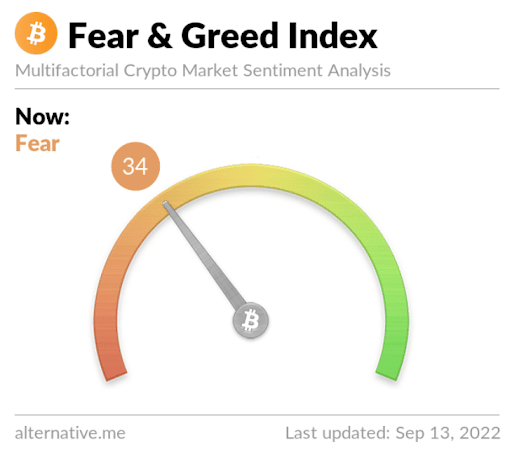
The Fear and Greed Index is 34 Fear and is +9 from yesterday’s reading of 25 Extreme Fear.

Bitcoin’s Moving Averages: 5-Day [$20,235.05], 20-Day [$20,999.31], 50-Day [$21,833.13], 100-Day [$25,151.65], 200-Day [$33,992.49], Year to Date [$32,462.58].
BTC’s 24 hour price range is $21,538.5-$22,488 and its 7 day price range is $18,650-$22,488. Bitcoin’s 52 week price range is $17,611-$69,044.
The price of bitcoin on this date last year was $44,945.
The average price of BTC for the last 30 days is $21,363.8 and its -7.5% over the same time frame.
Bitcoin’s price [+2.56%] closed its daily candle worth $22,395.3 and in green figures for a sixth consecutive day on Monday.
Ethereum Analysis
Ether’s price again traded lower at its session’s close than at Monday’s open and it concluded its daily frame -$50.56.
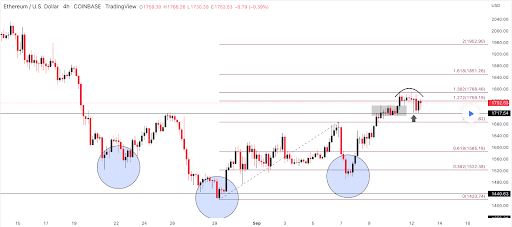
Today’s second chart of emphasis is the ETH/USD 4HR chart below by DannyC914. ETH’s price is trading between the 1 fibonacci level [$1,686.82] and 1.272 [$1,759.19], at the time of writing.
The overhead targets for bullish traders are the 1.272 fib level followed by 1.382 [$1,788.46], 1.618 [$1,851.26] and lastly the 2 fib level [$1,952.90].
Conversely, the targets to the downside of Ether’s 4HR chart are the 1 fib level, 0.618 [$1,585.18], 0.382 [$1,522.38], and 0 [$1,420.74].

Ether’s Moving Averages: 5-Day [$1,659.09], 20-Day [$1,659.86], 50-Day [$1,572.57], 100-Day [$1,706.00], 200-Day [$2,438.58], Year to Date [$2,276.57].
ETH’s 24 hour price range is $1,693-$1,783 and its 7 day price range is $1,502.29-$1,783. Ether’s 52 week price range is $883.62-$4,878.
The price of ETH on this date in 2021 was $3,285.09.
The average price of ETH for the last 30 days is $1,679.25 and its -8.24% over the same period.
Ether’s price [-2.86%] closed its daily candle on Monday worth $1,716.43 and in red digits for the second day in a row.
Theta Analysis
Theta’s price broke up two days of selling pressure from bearish traders on Monday and finished its daily candle +$0.007.
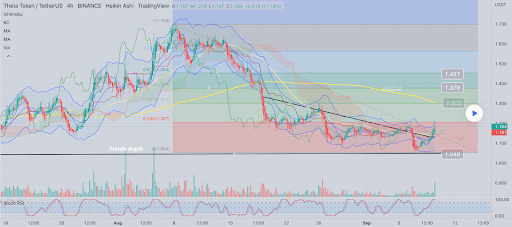
The final chart we’re looking at today is the THETA/USD 4HR chart below from ferulianov. Theta’s price hasn’t responded as favorably over the last 45-60 days as much of the alt coin market.
We can see that Theta’s price is bumping up against the 0.236 and has been unable to break that level thus far with candle close confirmation. If bullish Theta traders can break the 0.236, they’ll shift their focus to 0.382 [$1.30], 0.5 [$1.37], 0.618 [$1.45], 0.786 [$1.56], and 1 [$1.70].
Bearish traders are looking to hold the line and continue to deny bullish traders access above the 0.236 fib level. If they’re successful at stalling Theta’s rally to the upside, their target of hitting a full retracement at 0.00% [$1.05] becomes increasingly probabilistic.

Theta’s Moving Averages: 5-Day [$1.13], 20-Day [$1.21], 50-Day [$1.28], 100-Day [$1.39], 200-Day [$144.82], Year to Date [$112.04].
Theta’s 24 hour price range is $1.15-$1.22 and its 7 day price range is $1.07-$1.22. Theta’s 52 week price range is $0.96-$8.56.
Theta’s price on this date last year was $6.13.
The average price of THETA over the last 30 days is $1.24 and its -27.04% over the same duration.
Theta’s price [+0.59%] had a daily candle close of $1.187 on Monday.
