Where to buy the dip? Buy zones for multiple cryptocurrencies
I’ll preface this article with this: I’m going to keep the analysis short as I can and just provide some levels I’m looking at for buying and/or adding to existing positions.
Cardano (ADAUSD)
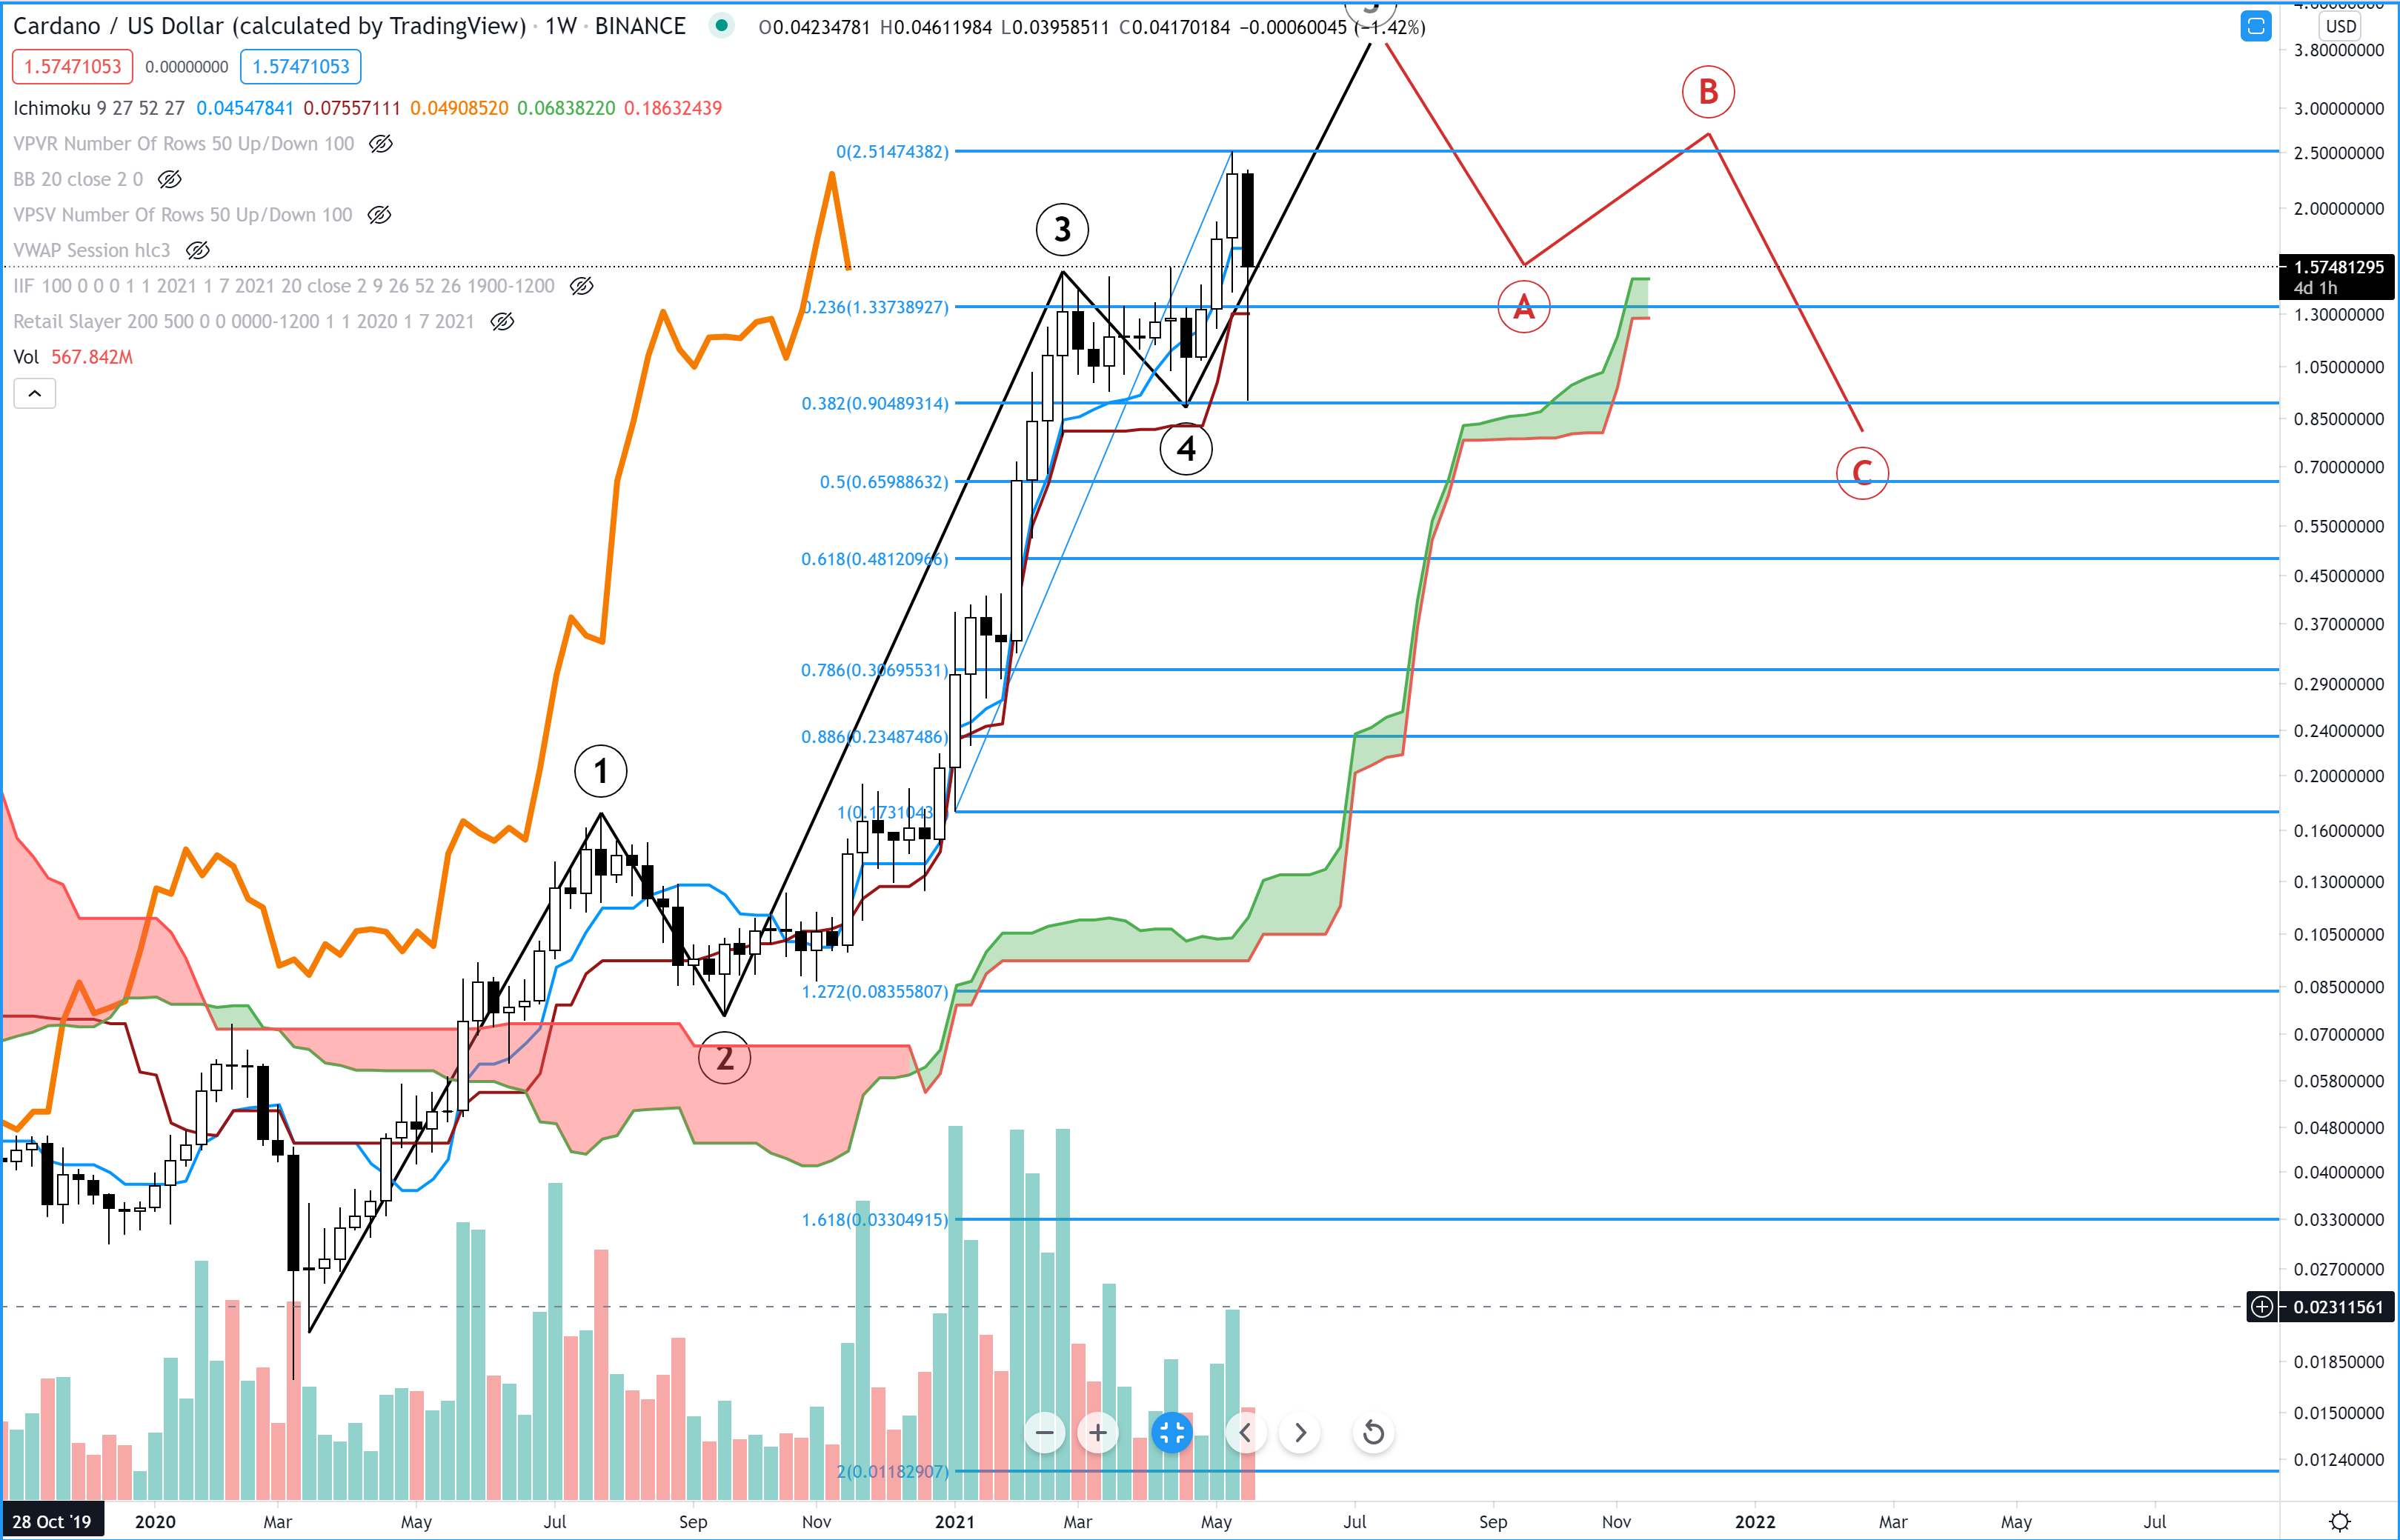
Above: Cardano (ADAUSD) Weekly Chart
Refer to the analysis provided on May 18th for more details here, but the buy limit zones I see for Cardano remain at a prior support zone between 0.84 and 0.94. Below that, I’d like to get in slightly above the 50% Fibonacci Retracement at 0.6598.
Basic Attention Token (BATUSD)
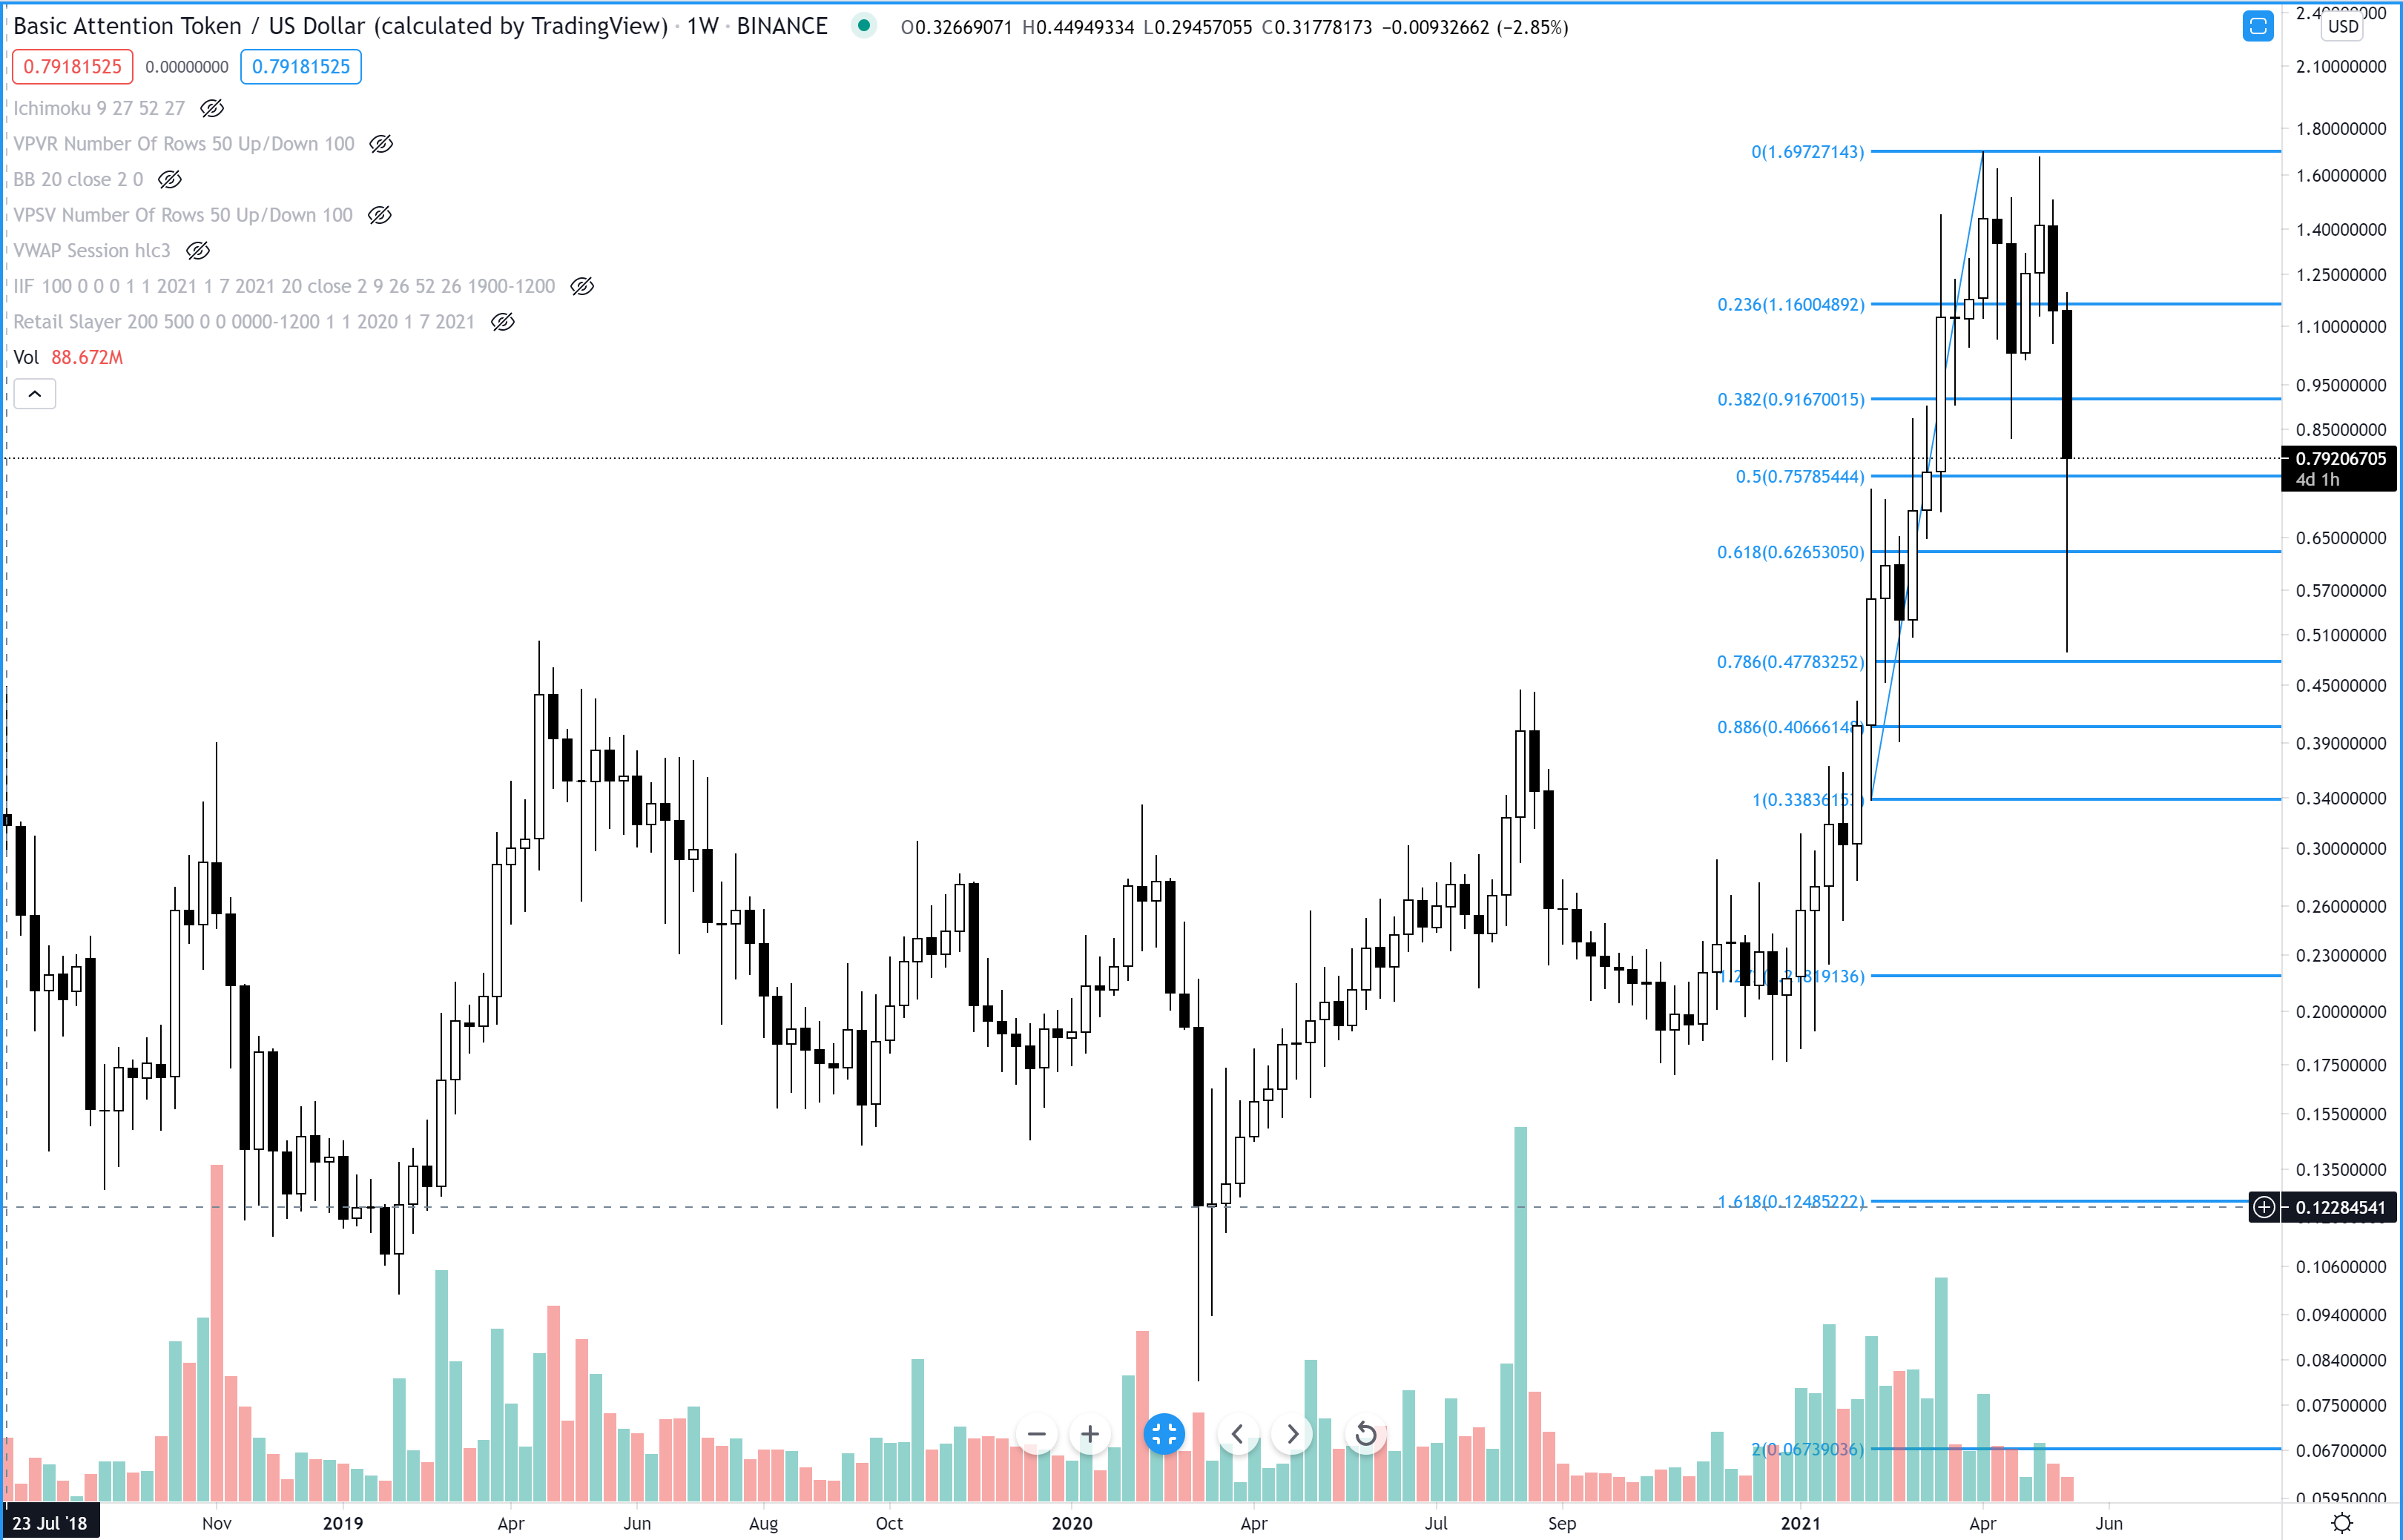
Above: Basic Attention Token (BATUSD) Weekly Chart
 Basic Attention Token’s price action during the Wednesday route has been fairly dramatic – it’s moved down as much as -57% at one point during the day. At the time of writing, Basic Attention Token is down nearly -30%. It’s ploughed through its 38.2%, 50%, and even the 61.8% Fibonacci Retracement levels. It found support at the 78.6% level. I like buy limit orders at the 61.8% level (0.6265) and if it can return to the 78.^% level (0.4778). I’d be hopeful and lucky if it tagged the 100% retracement at 0.338.
Bitcoin (BTCUSD)
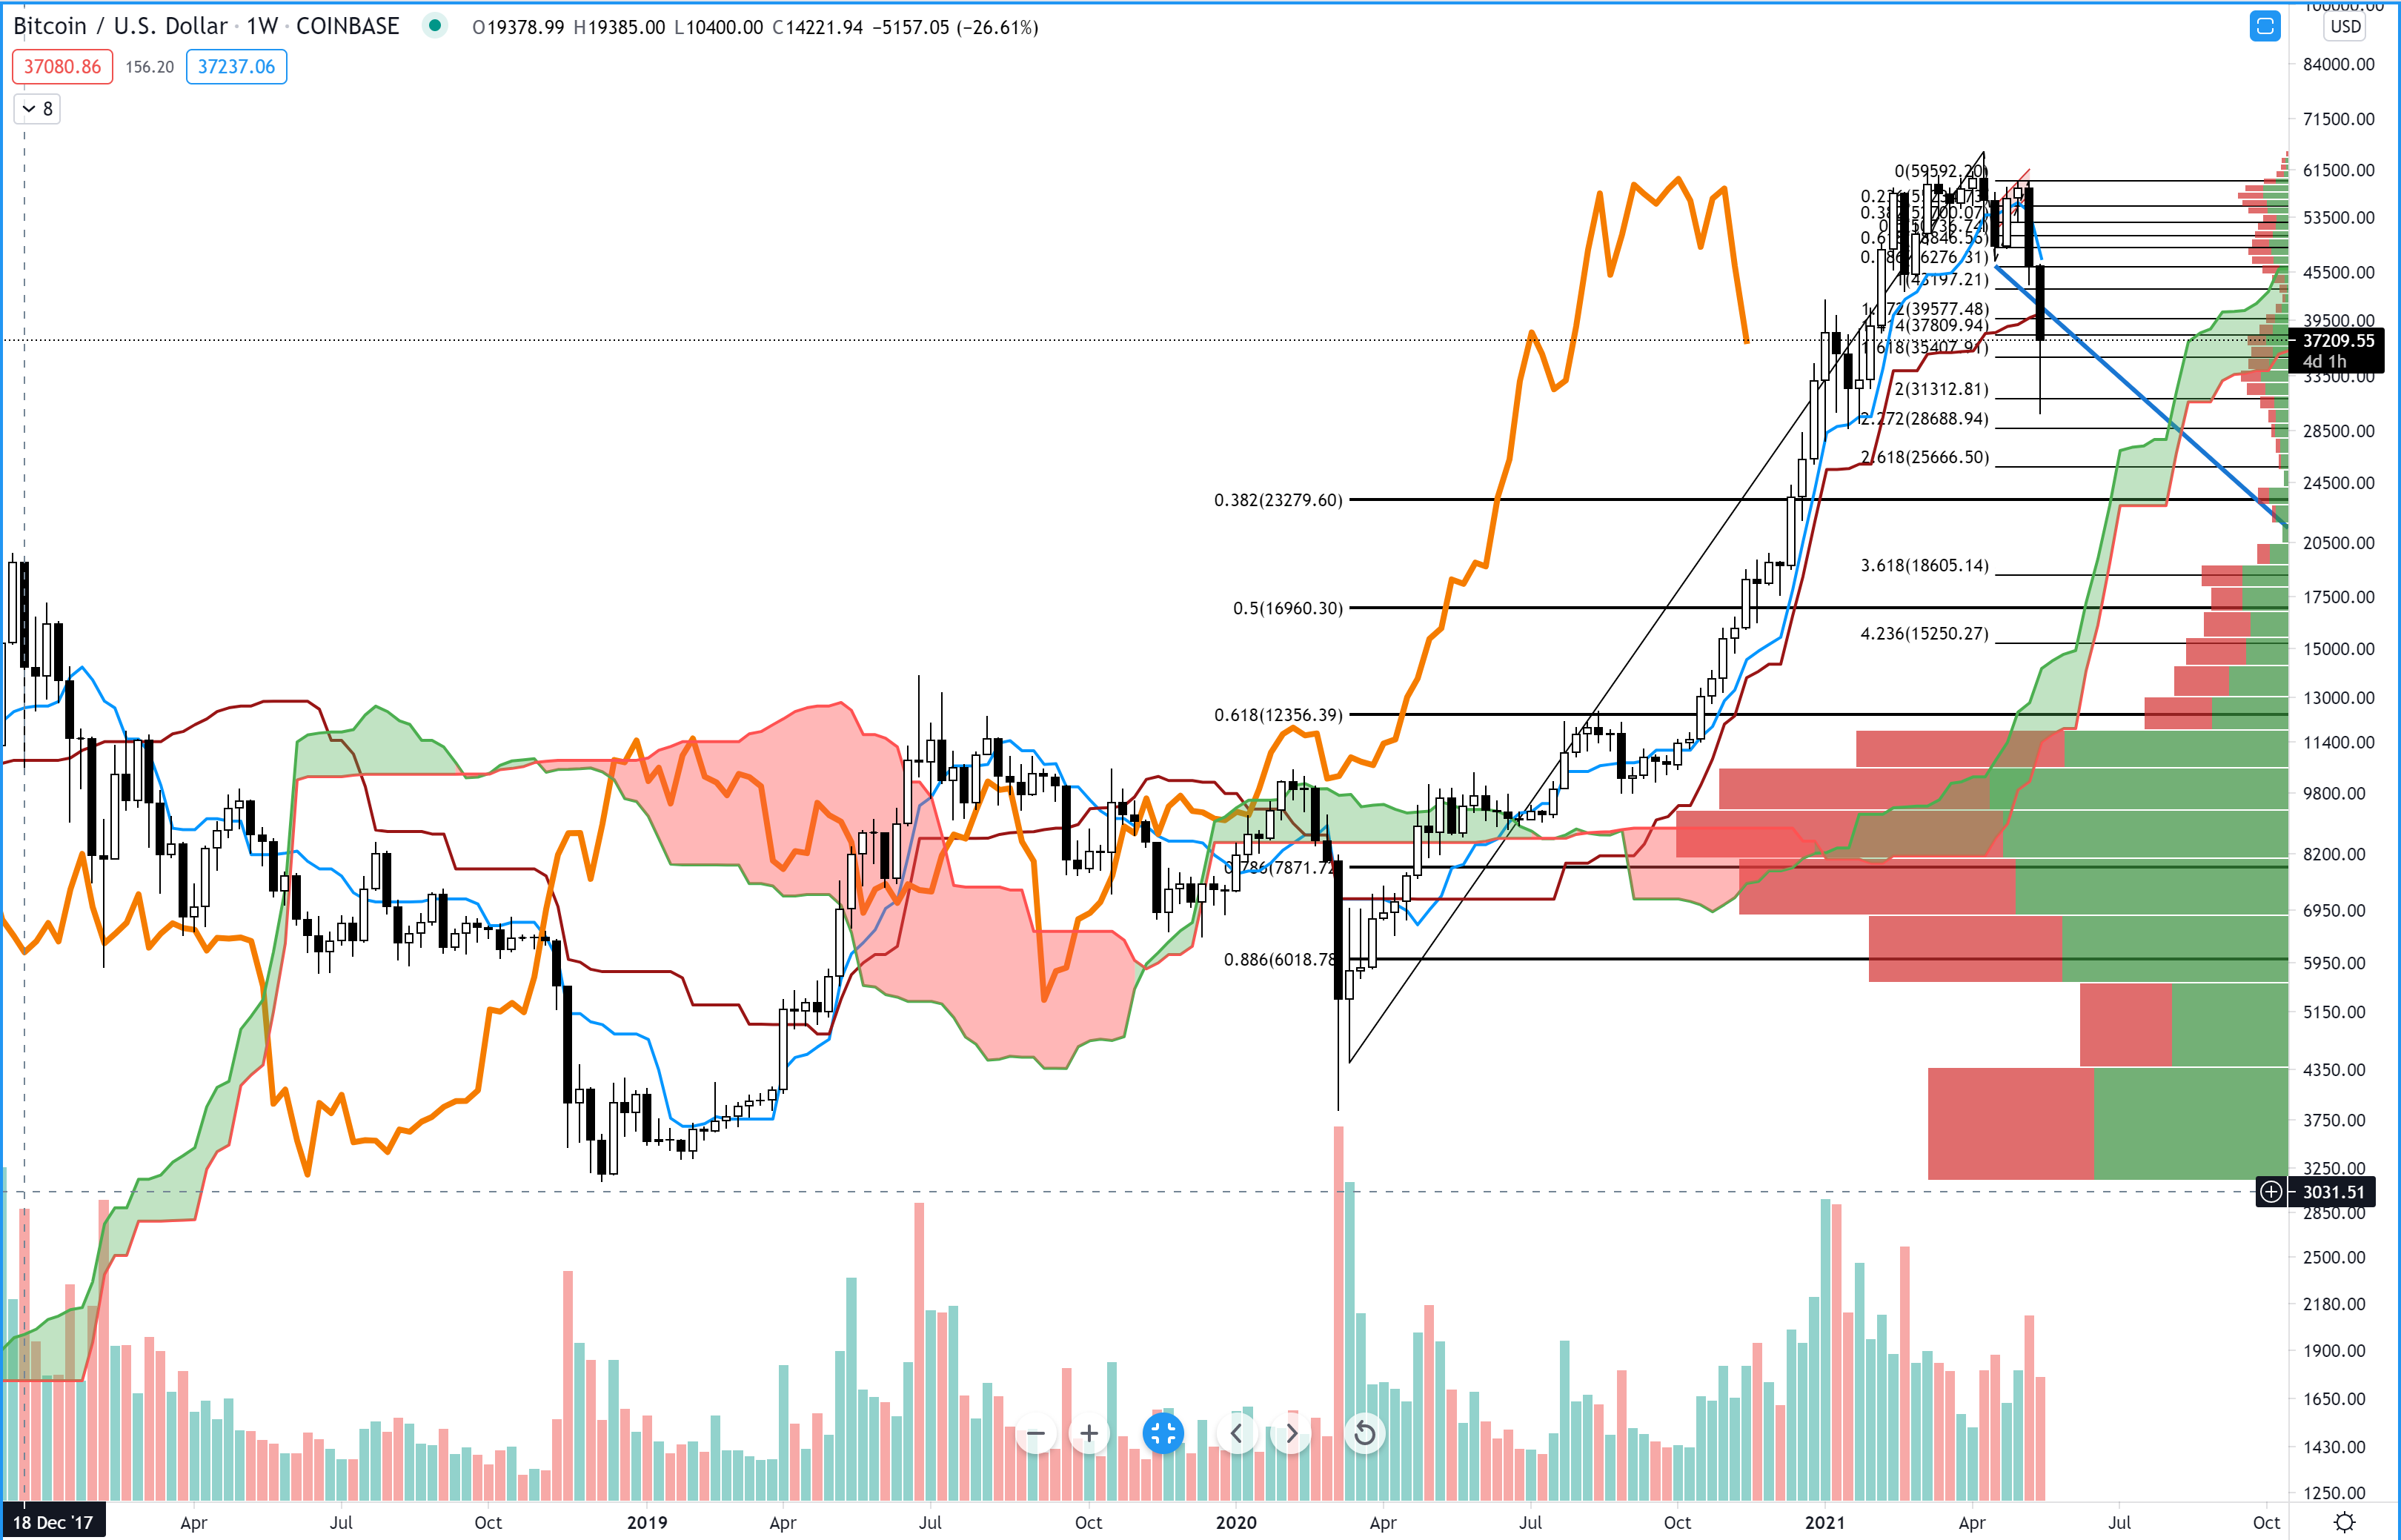
Above: Bitcoin (BTCUSD) Weekly Chart
Any regular viewers and readers will know about the daily analysis I do over Bitcoin – so let’s keep it simple. I like the buy limit order at 34,000 because of the confluence of a high volume node and the 61.8% Fibonacci Extension. 34,000 is also where the monthly chart’s Kijun-Sen is at. Below that, I like another confluence zone of Fibonacci Extension levels and high volume nodes at 23,279.
Dogecoin (DOGEUSD)
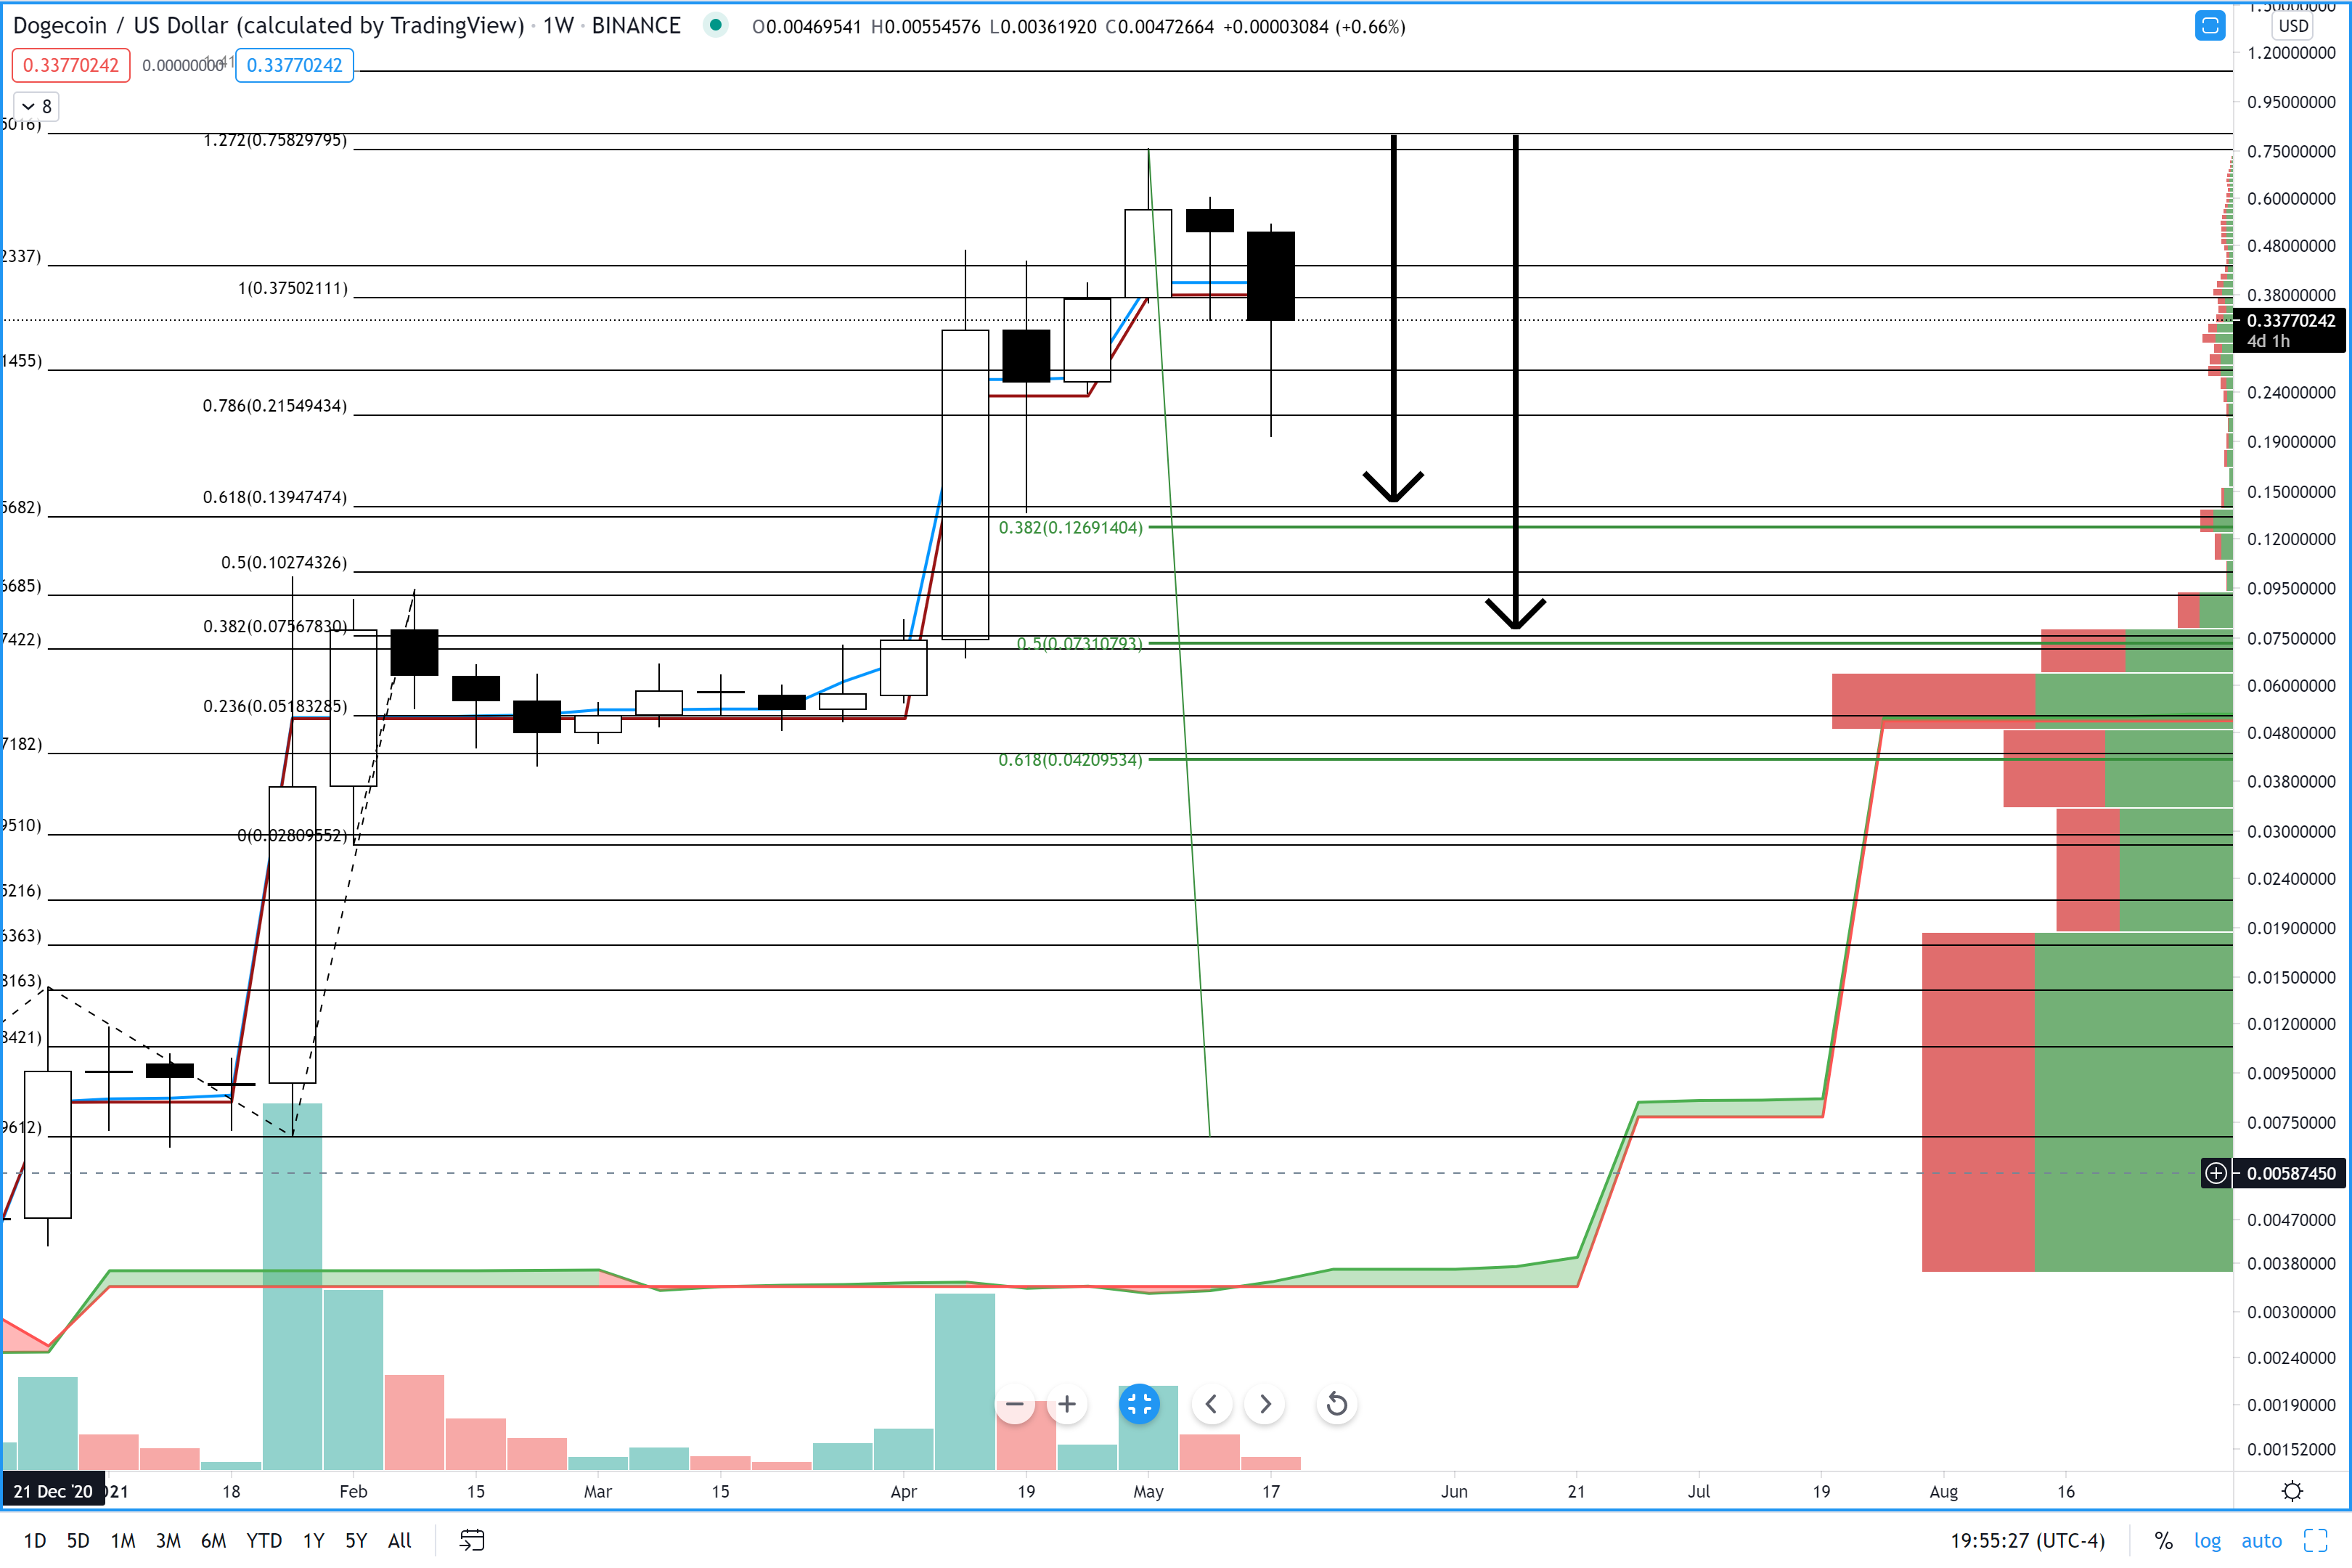
Above: Doge (DOGEUSD) Weekly Chart
Surprisingly, Doge has done fairly well compared to its peers (that it actually has peers is weird). Again, for consistent readers and viewers, the following buy limit levels for Doge are the same as my prior analysis. 0.138 has a congestion zone of Fibonacci Extension and Retracment levels, as well as a high volume node in the volume profile. The next level is where the VPOC (Volume Point Of Control) shared a price level with three important Fibonacci levels: 0.066. 0.66 would be the most ideal entry on Doge’s chart.
ChainLink (LINKUSD)
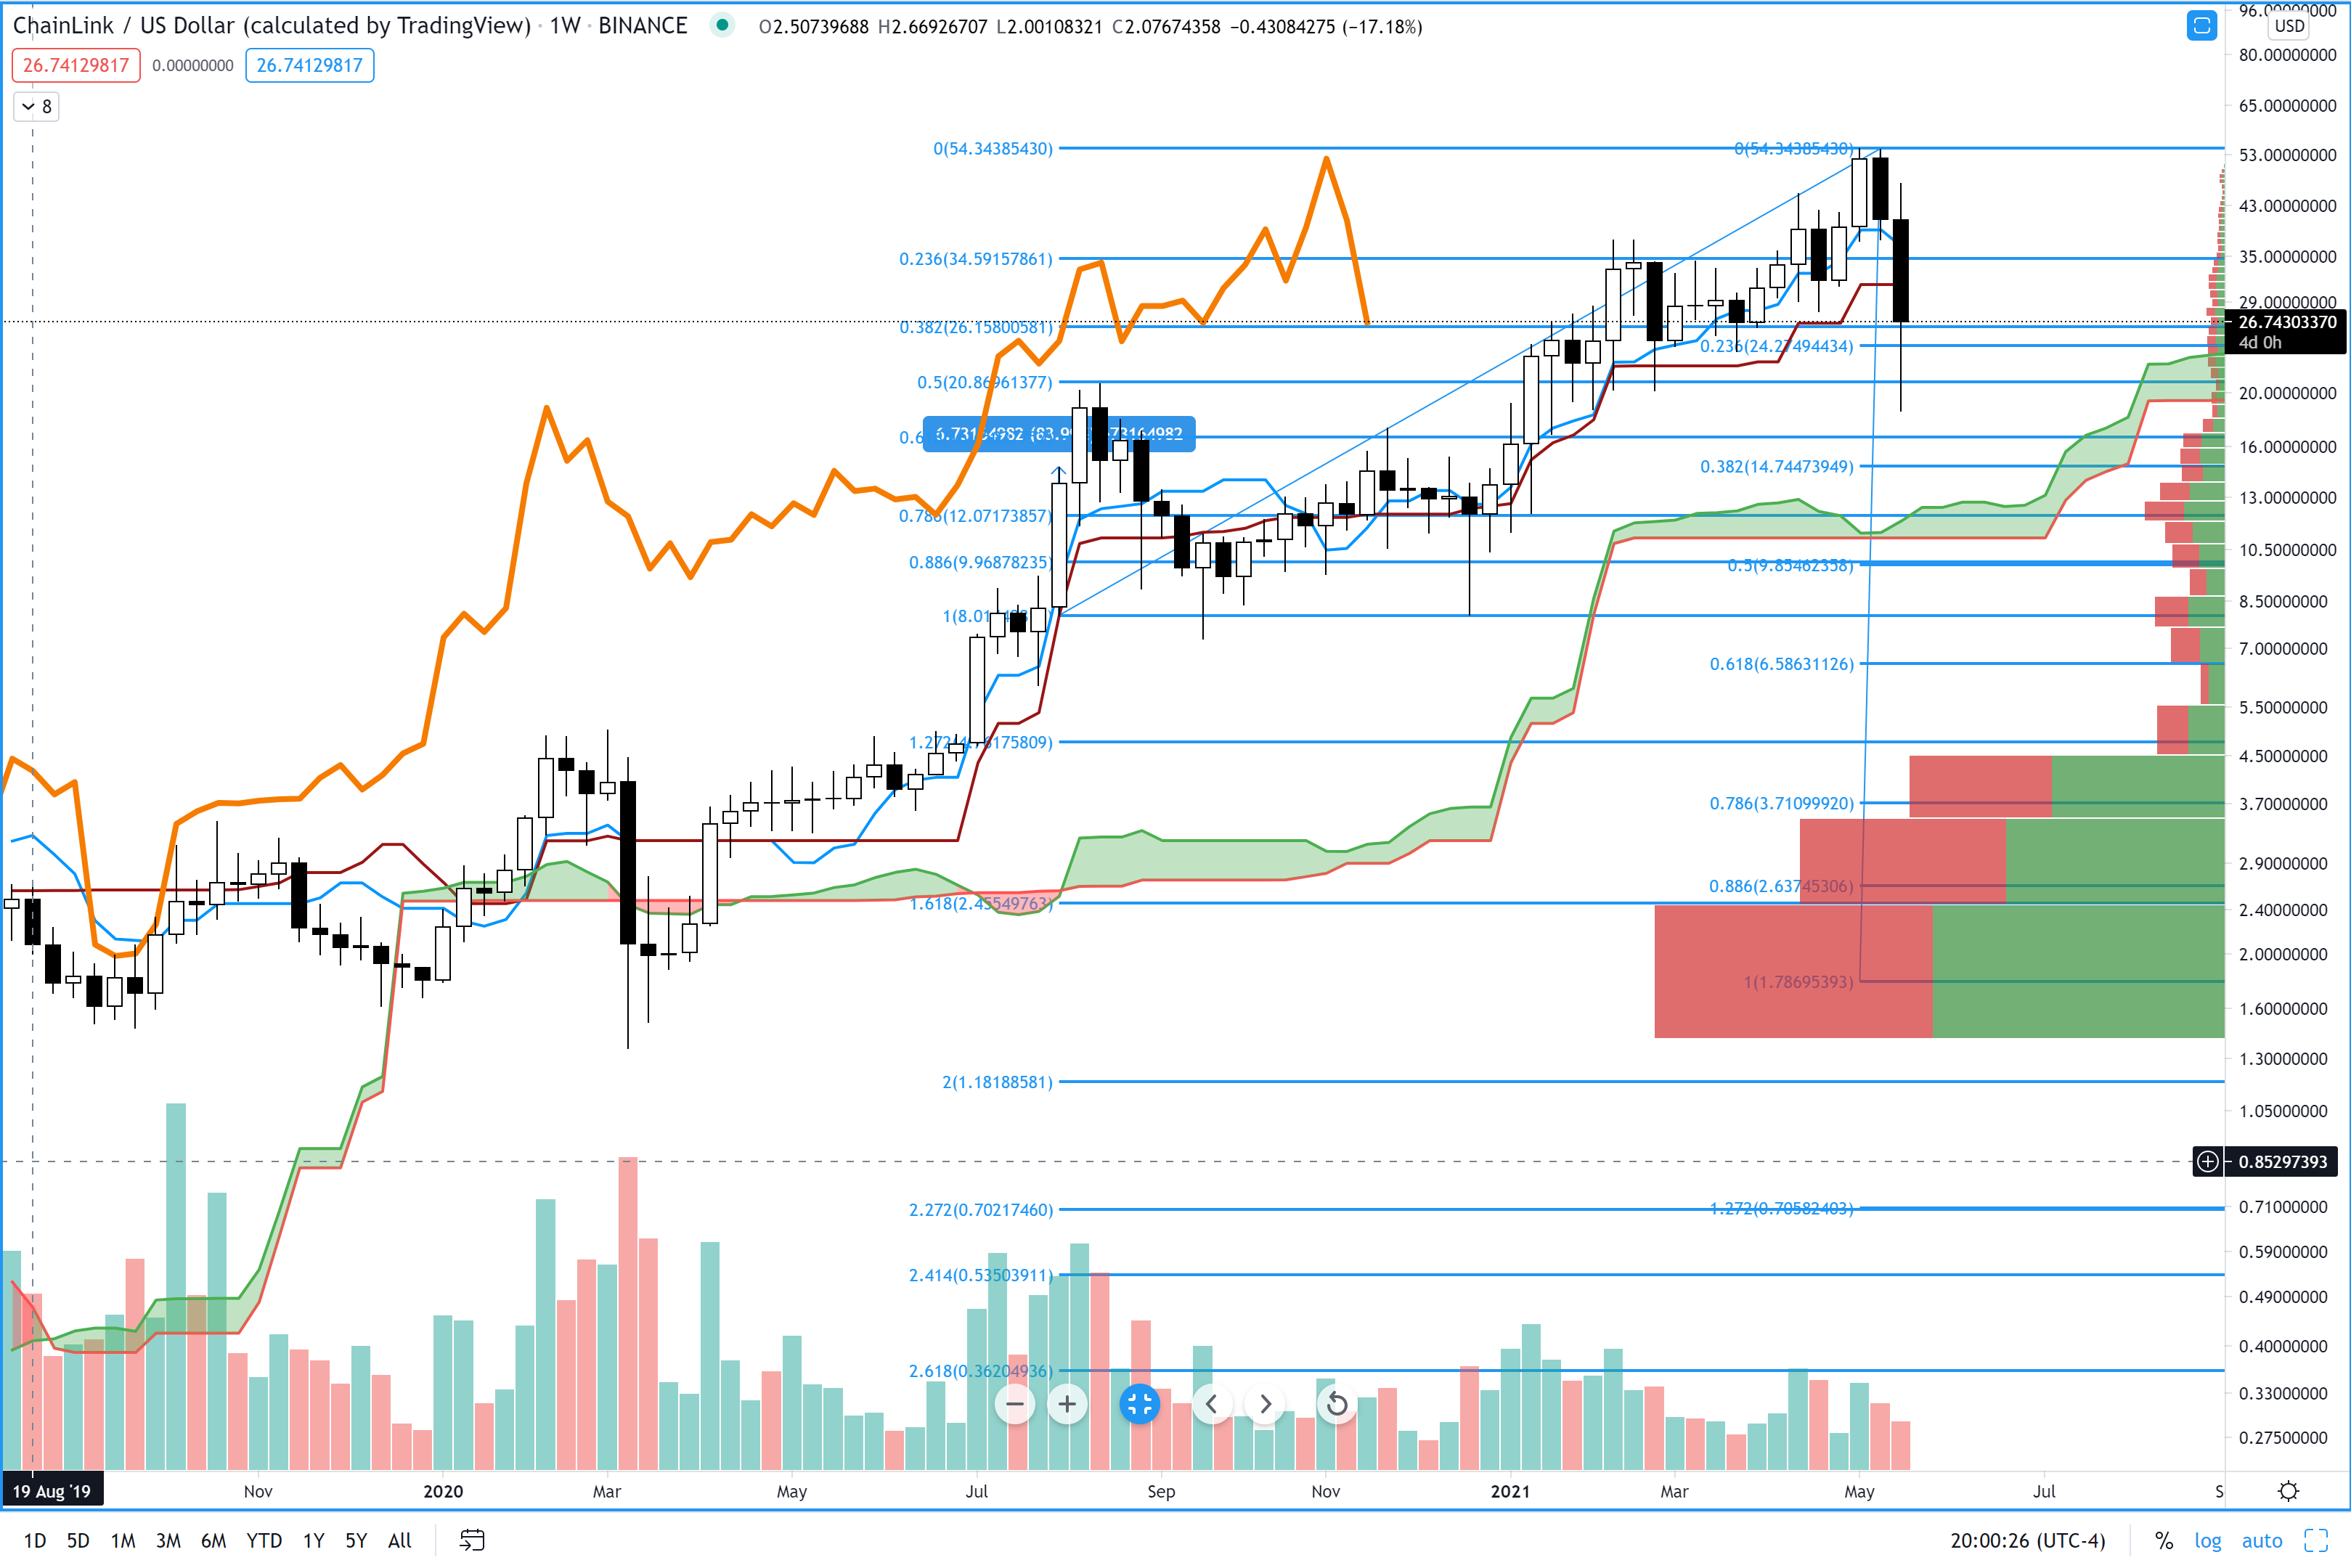
Above: ChainLink (LINKUSD) Weekly Chart
There’s really only one price range that I feel is worth looking at on ChainLink’s chart and that’s between 10.01 and 12.43. Right around the 10.00 mark we have an extremely powerful 88.6% Fibonacci Retracement on top of a 50% Fibonacci Retracement. 10.97 is where the weekly Senkou Span B is at – this is important because Senkou Span B is the strongest support/resistance level in the Ichimoku system. And because Senkou Span B is long and flat, it means it’s very powerful and likely to hold as a support for ChainLink. Finally, at 12.36 is a high volume node in the volume profile. Basically, I am looking to long anywhere between 10.00 and 12.50.
OmiseGo (OMGUSD)
Above: OmiseGo (OMGUSD) Weekly Chart
Like LINK above, there’s only one price range I see on OmiseGo’s chart as a long entry. 4.96 is the 61.8% Fibonacci Retracement. Just above that level is the weekly Senkou Span B and just blow Senkou Span A. There is also a high volume node in the volume profile present at this level. If OmiseGo returns to the 4.96 value area, I’m looking to buy.

