- VeChain price has seen a massive 50% rebound from a low of $0.13.
- The digital asset could see another upswing in the short-term according to technicals.
- VET bulls must conquer a key resistance level to confirm an uptrend.
VeChain, like the rest of cryptocurrencies, had a major drop in the last two days and lost close to $8 billion in market capitalization, gaining around $4 billion in the last 24 hours.
VeChain price aims for a massive rebound if key resistance level is broken
VeChain price has seen a significant rebound in the last 24 hours from its low of $0.13 to $0.194 at the time of writing. The digital asset only faces one last key resistance level at $0.195, which is the 50 SMA.
VET/USD 6-hour chart
A 6-hour candlestick close above the 50 SMA support level will confirm a short-term uptrend. Additionally, the TD Sequential indicator has just presented a buy signal which is also increasing the buying pressure of VET.
VET/USD 12-hour chart
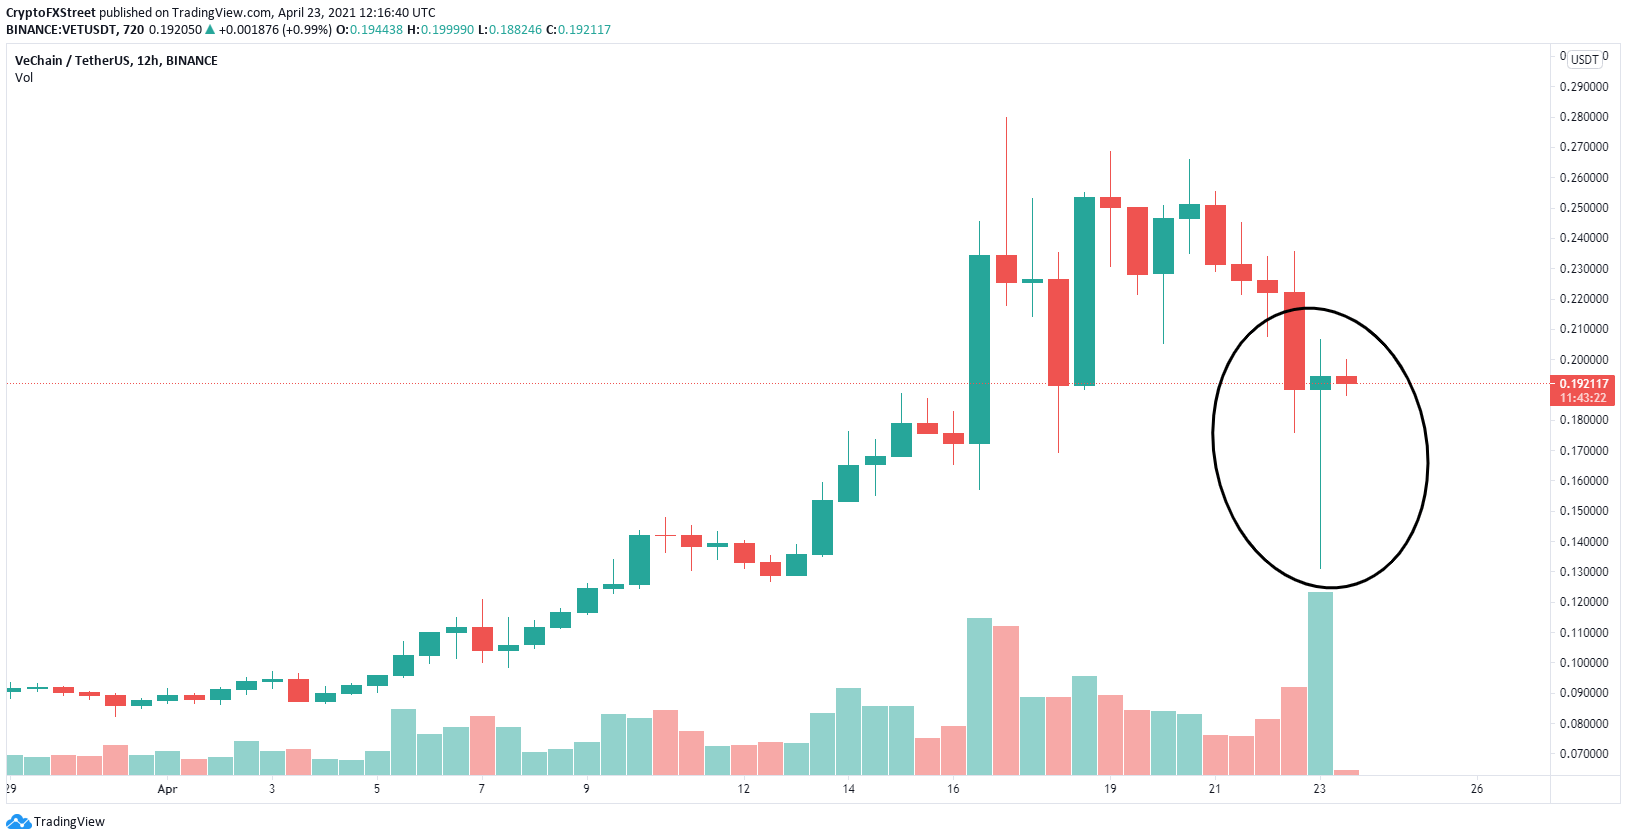
On the 12-hour chart, VeChain has formed a hammer candlestick, which is considered extremely bullish, and a reversal candlestick. It signals the asset is near a bottom, but there needs to be other factors to be confirmed, like the buy signal mentioned above.
VET/USD 4-hour chart
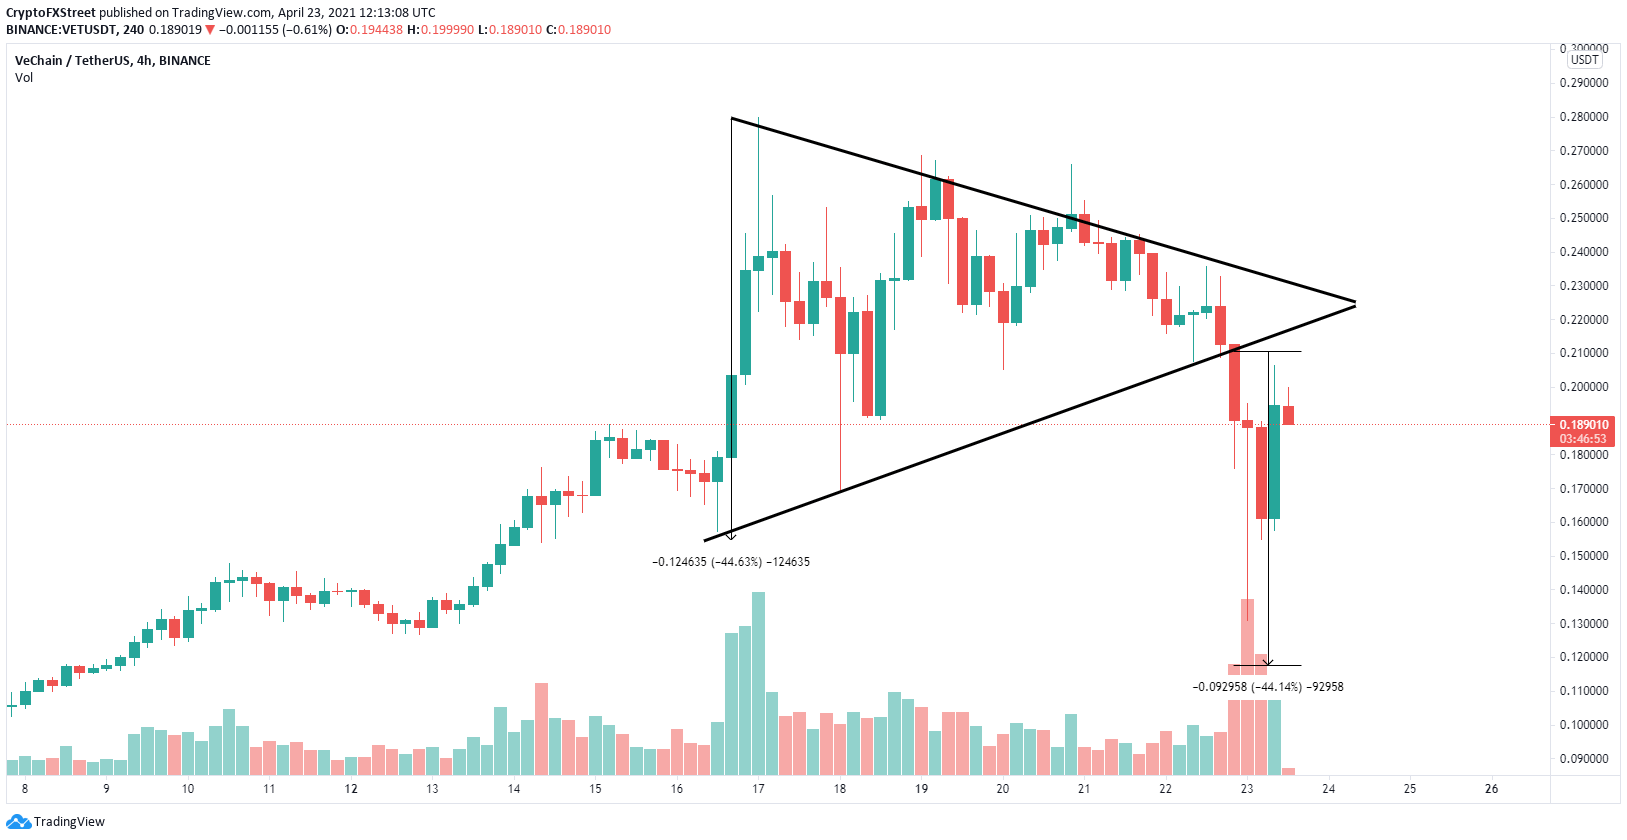
However, on the 4-hour chart, VeChain price had a breakdown from a symmetrical triangle pattern which has a long-term price target of $0.118. This was not met in the last crash and the previous support trend line will most likely act as a strong resistance level which can quickly push VeChain price down to the target of $0.118.


