- Theta price had a significant breakout above a symmetrical triangle on the 4-hour chart.
- The bulls target $3 as the long-term potential for Theta.
- The digital asset could see a small pullback before resuming its uptrend.
Theta has been trading inside a tightening range since the beginning of 2021. The digital asset outperformed many cryptocurrencies since November 2020. Now, bulls have managed to push it above a crucial resistance level and aim to drive Theta price to $3.
Theta price can quickly reach $3 as there is very little resistance to the upside
On the 4-hour chart, Theta has established a symmetrical triangle pattern from which has seen a breakout with a price target of $3 in the long-term. This number is calculated using the maximum height of the pattern.
THETA/USD 4-hour chart
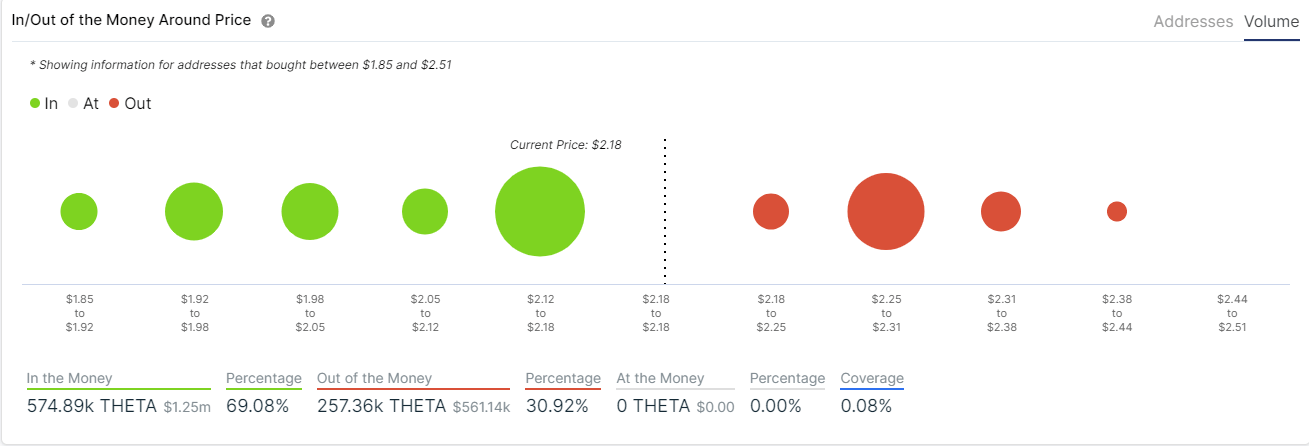
The In/Out of the Money Around Price (IOMAP) model shows the next resistance area to be located between $2.25 and $2.31, where 69 addresses purchased 215,000 Theta coins. A continuation move above this point would easily push Theta price towards $3.
THETA IOMAP chart
However, the IOMAP also indicates that the critical support level between $2.12 and $2.18 must be held. This area coincides with the previous resistance trendline of the triangle pattern. It is common for an asset that breaks out to come back and re-test the former resistance level which means we could see Theta price touch $2.12 again before a full blown breakout.

