Kameleon007/iStock Unreleased via Getty Images
With Ryan Wilday and Avi Gilburt
The news is getting pretty bearish out there on Ethereum. This year has been awash with new speculation about delays in the launch of the Proof of Stake conversion also known as ETH 2.0. Additionally, there have been bearish-leaning reports about drops in TVL (Total Value Locked) and how much that appears to correlate with price. Lastly, it’s been deemed news-worthy that Jack Dorsey is something of an Ethereum skeptic in this recent Forbes piece:
Those that follow our work, and in particular, our subscribers at Crypto Waves, know that Ryan Wilday and I shy away from being swayed by the winds of sentiment. Maintaining an opinion that’s flexible to changing conditions but is not changing moment-to-moment based on feelings is key in all markets – and crypto, in particular – considering the volatility. Before diving into the current technical posture, providing the Elliott Wave context to understand the current action, I wish to state that while in the short run ETH is at risk of substantial decline, my medium and longer-term expectations for ETH entail considerably higher prices. Specifically, I’m looking for the $9,200 region to be stuck inside of the next 18 months.
Lastly, a note about the signal “Author’s Rating.” This singular piece of information is too oversimplified to be useful. My outlook for the longer term is quite bullish insofar as my expectations are for the price to rally in excess of 3x the current price as of writing. However, in the short term, the pattern I am tracking calls for a potential 50%-60% decline. So, in the immediate view, with ETH trading below $3,580–the early April high – the outlook is quite bearish. Overall, the reason for my “Buy” rating is that the larger picture is still quite bullish, and pullbacks that remain over $1,000-$1,200 can be treated as a buying opportunity.
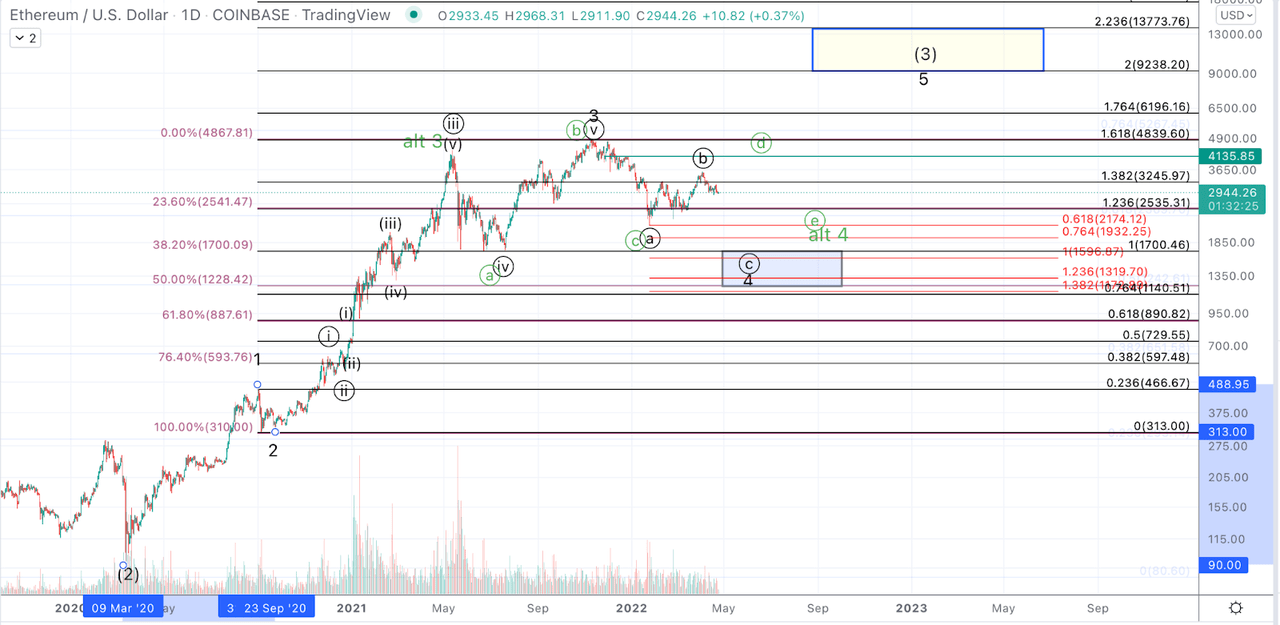
Ethereum appears to be in the process of forming an Elliott Wave Impulsive pattern off the March 2020 lows. This type of pattern entails a trending advance that achieves its target in a 5 wave move. As Elliott Wave views markets as fractal in nature, the motive waves of a larger impulse (i.e., those moves that advance price in the direction of the trend), waves 1, 3, and 5, are themselves self-similarly composed of 5 wave moves. In addition to the description above, it’s important to note that these larger patterns and their component subwaves have a typical range of proportions among the waves. What’s key to note is that after the first two waves are established, waves 1 and 2, we are provided with a range of targets for each of the subsequent waves. Also, as portions of waves 3 and 4 fill in, one is able to make substantive adjustments to wave 5 targets based on the behavior of the preceding waves.
In a “standard” Elliott Wave pattern, the assumed target for the 3rd wave is the 1.382-1.618 Fibonacci extension, and for the 5th wave to achieve the 1.764-2.0 Fibonacci extension of the wave from the low of the wave 2. With those parameters in mind, let’s take a look at Ethereum.
Off the March 2020 low, Ethereum rallied over 5x into the early September high, forming the initiation move, or wave 1. Following a very high consolidation in which price provided only a minimal pullback into late September, ETH took off to the upside, gaining another 2x into the early December high in 5 waves, forming wave i of 3, and achieving the standard .382 extension of wave 1. Similarly, this next wave ii of the wave 3 was quite shallow and completed as a flat correction.
Ultimately, regarding the recent peak, the all-time high struck in early November of 2021, ETH printed $4,867.81 (Coinbase Pro) which coincides almost precisely with the 1.618 extension, i.e., the higher end of the “standard” range for the wave 3 in an impulse.
After price reaches the 1.618 extension, the standard support level for the wave 4 sits at the 1.0 extension. Also, the corrective waves within an impulse strongly tend towards 3 wave moves (labeled A-B-C on the chart). While not required, it’s quite frequent to see a symmetrically proportional relationship between the A wave and C wave of a corrective move. Put simply, the C wave often extends to a level in which its length is equivalent to the A wave or a close Fibonacci relationship such as the .764 extension of the A wave (meaning the C wave is 76.4% the length in price of the A wave) up to the 1.382 extension of the A wave (meaning the C wave is 138.2% the length in price of the A wave). Note the provided analysis is based on logarithmic scale calculations.
A few other relevant heuristics about wave 4s: While the standard retrace is typically the 38.2% retrace of the wave 3, the shallow end of support can be found at the 23.6% retrace and the deep end of support at the 50% retrace. A sustained break beyond the 50% retrace, though not invalidating the pattern, creates substantial doubt as to the prospect of price recovering to provide the (previously) expected 5th wave higher. Also, it’s quite typical to see wave 4s bottom in the area of the wave iv of one lesser degree.
Note, the 1.0 extension is $1,700, the smaller degree wave iv bottomed at $1,700, the 38.2% retrace is at $1,706. As can be seen, there’s excellent confluence at approximately $1,700. The bottom end of the support region comes in at $1,234. Please consider that a break below $1,234, while not desirable towards maintaining the bullish outlook, should not have us abandon upside targets on a brief break. As previously seen at other major lows, capitulations have been met with a huge range of liquidity depending on exchange; thus, some temporary over-reaction should not be cause for abandoning a bullish outlook.
Bigger picture, so long as the price maintains without any prolonged break below the $1,200 region–the 2.0 level, $9,238 is the ideal target for the next move off the 2020 low. That entails substantial downside left in this correction but those who are prepared with cash would be wise to see this as a good risk-to-reward buying opportunity, provided that those investors are prepared for the noted likelihood of volatility.
At the smaller time frame, as noted, the primary expectation is for a substantial decline. This path displayed with the black labels on the accompanying chart is preferred only if the price remains below the early April high, $3,581.60. The minimal downside expectation is a retest of the February lows but should ETH break above $3,582 first, expectations are for continued consolidation in the larger corrective range to fill out waves D and E of the corrective wave 4 triangle (displayed). Given that the triangle scenario would not provide such prices and would likely continue the consolidation into this summer, the black is preferable, but investors should be prepared for reasonably likely visible scenarios.
Finally, I’ll reiterate the distilled bigger picture: As long as the longer-term support ($1k-$1,200) is not broken on a sustained basis, expectations are for ETH to trade substantially higher in the coming quarters.
Jason Appel (Crypto Waves)