Bitcoin Analysis
Bitcoin’s price closed the week’s final day with a red candle and BTC’s price concluded its daily session -$694.7.
The BTC/USD 1D chart below from malmsteen23 is the first chart we’re analyzing for this Monday and we can see that BTC’s price is at a critical level. BTC’s price is trading between the 161.80% fibonacci level [$11,758.81] and 100.00% [$33,541.76], at the time of writing.
If BTC’s price fails to break out of its current descending channel then a test of the 161.80% would be the eventual target of bearish traders.
Conversely, the targets to the upside on BTC are 100.00%, 78.60% [$41,084.73], 61.80% [$47,006.31], 50.00% [$51,165.51], 38.20% [$55,324.72], 23.60% [$60,470.85], and the 0.00% fib level [$68,789.26].
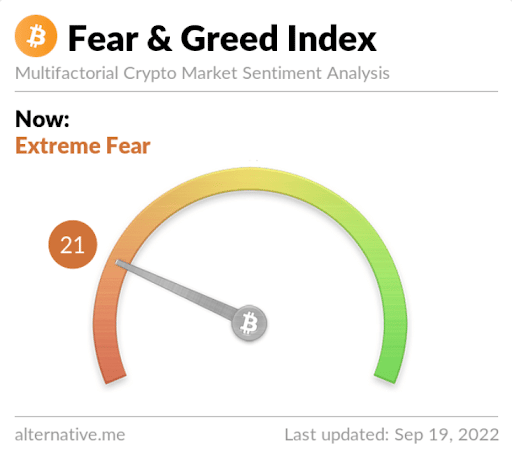
The Fear and Greed Index is 21 Extreme Fear and is -6 from yesterday’s reading of 27 Fear.

Bitcoin’s Moving Averages: 5-Day [$20,437.98], 20-Day [$20,398.6], 50-Day [$21,748.33], 100-Day [$24,395.62], 200-Day [$33,407.32], Year to Date [$32,193.44].
BTC’s 24 hour price range is $19,335.6-$20,102.2 and its 7 day price range is $19,335.6-$22,534.61. Bitcoin’s 52 week price range is $17,611-$69,044.
The price of Bitcoin on this date last year was $47,239.
The average price of BTC for the last 30 days is $20,597.7 and its -18.7% over the same time frame.
Bitcoin’s price [-3.45%] closed its daily candle worth $19,417.7 on Sunday and has finished in green figures for two of the last three days.
Ethereum Analysis
Ether’s price finished its daily candle on Sunday -$134.76 and ETH’s sell-off has continued following the Ethereum network’s merge from PoW to PoS last week.
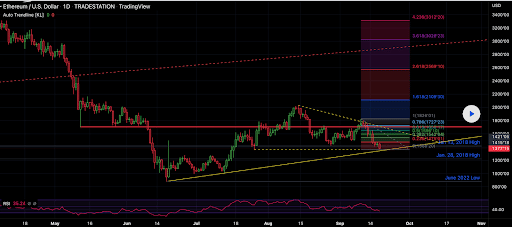
The second chart we’re looking at to start a new week is the ETH/USD 1D chart below by CoolidgeEffect. ETH’s price is trading between the 0 fib level [$1,366.2] and 0.236 [$1,475.01], at the time of writing.
The overhead targets for Ether bulls are 0.236, 0.382 [$1,542.04], 0.5 [$1,596.1], and 0.786 [$1,727.23].
Bearish Ether traders are looking to go short and have the target of the 0 fib level and full retracement at $1,366.2. That level will also bring ETH back down to retest ETH’s former all-time high from January 28th, of 2018. If bearish traders can break those levels they’ll have their sights set again on pushing ETH’s price back down to triple digits.

Ether’s Moving Averages: 5-Day [$1,575.46], 20-Day [$1,603.48], 50-Day [$1,600.06], 100-Day [$1,653.24], 200-Day [$2,385.09], Year to Date [$2,260.71].
ETH’s 24 hour price range is $1,324-$1,473.8 and its 7 day price range is $1,324-$1,777.18. Ether’s 52 week price range is $883.63-$4,878.
The price of ETH on this date in 2021 was $3,328.40.
The average price of ETH for the last 30 days is $2,786.08 and its -28.81% over the same period.
Ether’s price [-9.17%] closed its daily candle on Sunday worth $1,334.64 and in red digits for the third time over the last four days.
Chainlink Analysis
Chainlink’s price was up greater than 14% for the previous four days prior to Sunday but when traders settled-up for LINK’s daily session it was -$0.57.
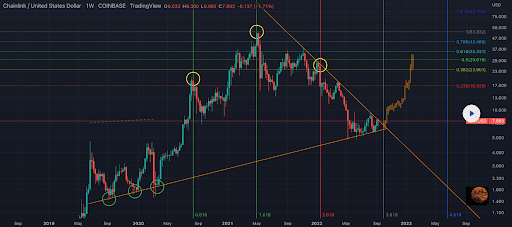
The last chart we’re looking at today is the LINK/USD 1W chart below from Sporia. We can see looking left and dating all of the way back to 2019, that LINK’s price has greatly respected this trend line.
The trendline was touched numerous times in the last bear market and market participants have already seen it tested a number of times during this bear market as well.
Traders of the LINK market may also be expecting a sizable move up or down potentially in the near future as it appears to again be decision time for LINK’s price.
The overhead targets for bullish traders if they can break out of the weekly time frame at the $8 level are 0.236 [$16.82], 0.382 [$23.9], 0.5 [$29.61], 0.618 [$35.33], 0.786 [$43.46], and the 1 fib level [$53.83].
Bearish traders on the other hand are looking to break that historical trend line on the 1W chart and inflict further damage as LINK’s price is already -85.7% from its all-time high.

Chainlink’s Moving Averages: 5-Day [$7.41], 20-Day [$7.13], 50-Day [$7.33], 100-Day [$7.35], 200-Day [$12.21], Year to Date [$11.62].
Chainlink’s 24 hour price range is $7.4-8.13 and its 7 day price range is $7.04-$8.24. LINK’s 52 week price range is $5.32-$38.17.
Chainlink’s price on this date last year was $27.4.
The average price of LINK over the last 30 days is $7.19 and its -11.07% over the same timespan.
Chainlink’s price [-7.08%] closed its daily session on Sunday valued at $7.52 and in red figures for the first time in five days.
